Two Categories, Same Margin, Wildly Different Returns on the Capital Behind Them

Executing a data-driven sku profitability analysis framework is the most effective operational adjustment a mid-market digital retailer can deploy to eliminate low-yielding inventory lines and maximise working capital efficiency across diverse product catalogues. Many e-commerce brand operators evaluate financial health using aggregate storewide revenue totals, completely failing to identify specific SKUs that consume warehouse space while returning sub-par gross margins. Funding slow-moving inventory lines locks up liquid working capital and forces media buyers to allocate advertising budgets to low-margin items. Transitioning to a Gross Margin Return on Inventory Investment model enables growth teams to clear stagnant inventory, protect marketing spend efficiency, and reallocate purchasing capital toward high-margin flagship products.
Modern e-commerce operations frequently suffer from severe capital inefficiency caused by unmonitored product catalogue expansion. As retail brands add new colour variants, sizing options, and accessory lines to capture incremental market share, catalogue complexity increases rapidly. Without itemized profitability auditing, low-velocity SKUs quietly accumulate in regional warehouses, absorbing storage fees and tying up cash flow that should be funding core growth initiatives.
Managing a digital store without tracking unit-level contribution margins introduces structural vulnerability into a corporate balance sheet. Standard financial statements report overall store performance, masking individual products that generate net contribution losses once picking labour, packaging, freight surcharges, and return handling fees are fully accounted for. When digital ad spend is distributed across an un-audited catalogue, marketing capital is routinely wasted on items with razor-thin margins, compressing net operating profits.
To establish a defensible commercial enterprise, retail executives must evaluate profitability at the individual stock-keeping unit level. Understanding the exact fully loaded contribution yield of every item allows supply chain and marketing teams to optimise inventory purchasing rules. Shifting from top-line sales targets to disciplined SKU-level margin governance ensures that inventory capital is concentrated exclusively in high-velocity, high-margin product categories.
Building a scalable retail business requires far deeper analytical capability than surface-level transaction volumes can provide. A structured sku profitability analysis framework relies on Gross Margin Return on Inventory Investment, or GMROII, to combine both halves of the problem into one number: it measures how many gross margin dollars a business generates for every dollar of inventory capital tied up, calculated by dividing total gross margin by average inventory cost. Incorporating this metric into your broader growth intelligence matrix enables commercial teams to measure the true capital productivity of every warehouse holding, rather than judging categories on margin percentage or turnover speed in isolation.
Optimising catalogue profitability through this framework is also directly linked to preserving paid acquisition efficiency. Acquiring cold traffic through paid customer acquisition campaigns becomes unsustainable if media budgets promote items that cannot absorb auction cost inflation. Protecting long-term customer lifetime value metrics requires ensuring that initial product entries deliver strong gross profit margins, providing the necessary financial buffer to fund post-purchase re-engagement workflows.
Validating catalogue optimization initiatives against established empirical business research underscores its commercial importance. Published research by the Harvard Business Review confirms that increasing customer retention rates by 5% scales overall corporate profits by 25% to 95%. This empirical baseline demonstrates why focusing inventory capital on high-retaining flagship SKUs protects repeat transaction velocity, generating the reliable cash flow required to support sustainable business expansion.
| SKU Classification | Operational Metric Profile | Capital Allocation Action |
|---|---|---|
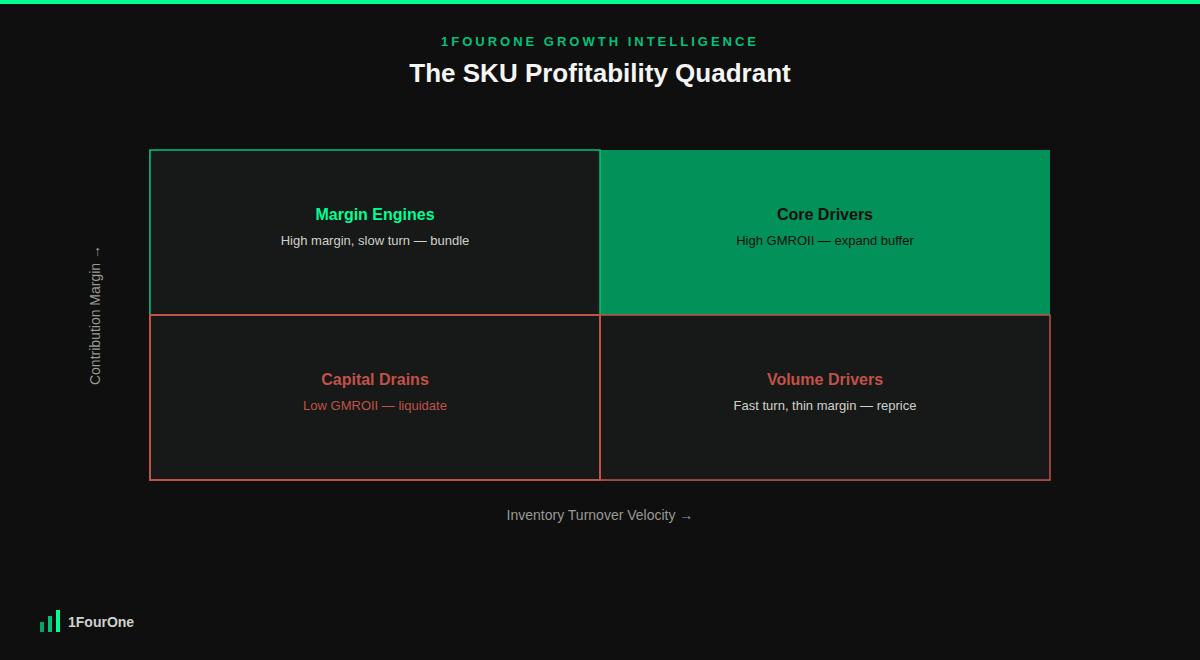
| Flagship Core Drivers | High turnover velocity and high contribution margin | Expanding inventory buffer depth to eliminate stockout leaks. |
| Margin Engines | Low turnover velocity but exceptional unit margin | Pairing with high-velocity items via dynamic product bundling. |
| Volume Drivers | High turnover velocity but thin contribution margin | Enforcing minimum order thresholds and dynamic price adjustments. |
| Capital Drains | Low turnover velocity and thin contribution margin | Initiating structured liquidation and immediate SKU trimming. |
To systematically identify underperforming inventory and maximise working capital returns, your commercial team must institutionalise this discipline across all sales channels. This operational approach replaces subjective catalogue planning with data-driven unit economic rules. The following five rules provide a repeatable methodology to audit SKU margins, protect marketing spend efficiency, and optimise catalogue capital allocation.
The foundation of effective catalogue governance is calculating the true fully loaded contribution margin for every product variant rather than relying on simple gross margin percentages. Evaluating items based solely on wholesale cost versus retail price ignores variable fulfilment expenses, packaging materials, merchant processing fees, and category return rates. Failing to account for these operational expenses leads to overestimating product profitability.
Calculate fully loaded contribution margins by deducting COGS, inbound freight, pick-and-pack labour, payment gateway fees, and average return handling costs from net retail realisation. Integrate these unit calculations into your inventory ordering protocols alongside guidelines from our operational framework on inventory allocation strategy. Itemizing true unit margins ensures purchasing budgets favor products that deliver positive contribution dollars.
Evaluating SKUs solely on gross margin percentage or sales volume in isolation creates distorted inventory purchasing decisions. A high-margin item that turns over only once per year locks up working capital for extended periods, yielding a lower GMROII than a medium-margin item that turns over six times per year. Operations teams must evaluate products using a combined velocity and margin matrix, not either metric alone.
Plot every SKU on a quadrant matrix comparing annual inventory turnover velocity against fully loaded contribution margin dollars, then calculate the GMROII for each quadrant. Categorise items into Core Drivers, Margin Engines, Volume Drivers, and Capital Drains. Reallocate inventory purchasing capital out of low-GMROII Capital Drain categories and into high-GMROII Core Drivers to elevate overall store capital productivity.
Setting uniform digital advertising bids across a diverse product catalogue is a common operational mistake that causes severe media spend waste. Low-margin SKUs cannot absorb high paid customer acquisition costs without generating net transaction losses, whereas high-margin bundles can comfortably support aggressive bidding. Media buyers must coordinate campaign target returns with SKU-level profit margins.
Integrate inventory unit margin data directly with ad account bidding structures to set dynamic target returns by product category. As outlined in our strategic breakdown of ecommerce dynamic pricing strategy, synchronising pricing rules with media bidding prevents ad capital allocation to low-margin items. Dynamic bid management ensures advertising spend remains aligned with actual product profitability.
Discounting slow-moving inventory through heavy sitewide sales is an unoptimised clearance tactic that erodes brand price equity and conditions customers to expect low prices. Slashing base prices on slow items damages catalogue positioning while failing to solve underlying demand issues. Commercial teams should use strategic product bundling to clear secondary inventory while protecting order values.
Structure promotional bundles that pair low-turn, high-margin accessory SKUs with high-velocity flagship products at an attractive combined price point. As documented in our operational guide on how to reduce checkout abandonment tactics, offering compelling bundled value during checkout elevates average basket size while clearing inventory. Strategic bundling liquidates stagnant stock without sacrificing net contribution margins.
Managing catalogue pricing in isolation without monitoring competitor positioning leaves your high-margin SKUs vulnerable to sudden market shifts. If a major competitor lowers pricing or launches aggressive promotional offers on a key product line, your sales velocity on that category can drop rapidly, turning a fast-moving item into a slow-moving capital drain. Analytics teams must monitor rival catalogue adjustments continuous.
Track competitor pricing adjustments, promotional frequencies, and stock availability across core categories. As detailed in our strategic guide on competitor ad audit 5 rules, tracking rival marketing strategies enables you to adjust pricing and promotional rules proactively. To keep your own catalogue quality benchmarks anchored in a recognised standard rather than internal guesswork, align your post-purchase satisfaction tracking with the guidelines in ISO 10004:2018. Incorporating parameters from our framework on predictive churn audit rules ensures you protect core customer lifetime value before competitive shifts impact sales volume.
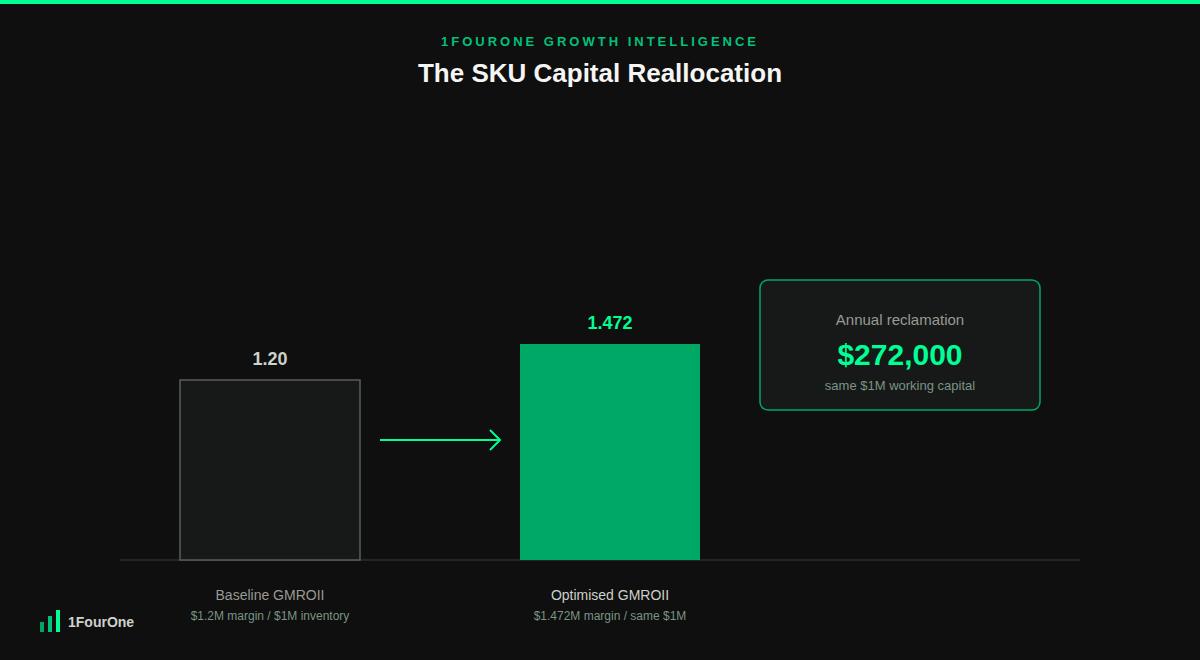
To evaluate the direct commercial impact of this framework, let us examine an established digital retailer carrying $1,000,000 in average inventory investment at cost across two distinct product categories (Category A: $500,000 inventory cost; Category B: $500,000 inventory cost). Total annual gross sales equal $3,000,000 with a baseline 40% gross margin ($1,200,000 baseline gross margin), yielding an overall store GMROII of 1.20 ($1,200,000 margin divided by $1,000,000 inventory cost).
Calculating GMROII by category uncovers a severe capital distortion between the two product lines. Category A (High-Turn Apparel) generates $2,200,000 in sales at a 40% margin ($880,000 gross margin) on $500,000 inventory cost, turning over 2.64 times per year at cost ($1,320,000 COGS / $500,000 inventory) for a strong GMROII of 1.76 ($880,000 / $500,000). Conversely, Category B (Slow Accessories) generates $800,000 in sales at a 40% margin ($320,000 gross margin) on $500,000 inventory cost, turning over only 0.96 times per year ($480,000 COGS / $500,000 inventory) for a poor GMROII of 0.64 ($320,000 / $500,000).
The brand’s growth operations team applies a structured sku profitability analysis framework to rebalance working capital. They reallocate $200,000 of inventory capital out of Category B (reducing Category B inventory cost to $300,000) and reinvest it into Category A (expanding Category A inventory cost to $700,000). Simultaneously, they bundle remaining Category B items with high-turn Category A products to maintain secondary sales velocity without discounting.
This inventory capital realignment transforms financial performance across the catalogue. The expanded inventory depth in Category A supports higher sales velocity, scaling Category A gross revenue to $3,080,000 ($1,232,000 gross margin at 40%). Category B sales contract slightly to $600,000 ($240,000 gross margin at 40%), but its inventory carrying cost drops to $300,000, drastically improving its unit capital efficiency.
The financial return from this capital reallocation program is immediate and highly profitable. Combined gross sales scale from $3,000,000 up to $3,680,000 on the exact same $1,000,000 total inventory investment at cost. Total gross contribution margin expands from $1,200,000 up to $1,472,000, pushing overall store GMROII from 1.20 up to 1.472. The business achieves a $272,000 annual gross margin reclamation derived entirely from inventory capital reallocation without increasing total working capital.
GMROII (Gross Margin Return on Inventory Investment) measures how effectively inventory capital invested in a product or category generates gross profit dollars over a specific timeframe, calculated by dividing gross margin by average inventory cost. A structured sku profitability analysis framework uses GMROII specifically because a simple margin check only evaluates the net profitability of an individual product variant without weighing how much capital that product actually ties up to generate those margin dollars. GMROII combines both margin and turnover into one number, which is why two categories with identical margin percentages can still return very different capital efficiency.
An e-commerce brand should execute a comprehensive SKU profitability audit quarterly to review catalogue capital productivity and adjust purchasing allocations. However, high-velocity items and campaign-promoted SKUs should be monitored monthly to catch sudden shifts in supplier costs, freight surcharges, or return rates before low-margin trends impact quarterly contribution profits.
No, slow-moving SKUs should not automatically be liquidated through direct price discounts, as flat price cuts degrade brand equity and erode product margins. Instead, explore strategic bundling options that pair slow-moving items with high-velocity flagship products, or use slow items as non-cash loyalty rewards or gift-with-purchase incentives to elevate average order values while clearing inventory.
High return rates severely degrade SKU profitability by adding secondary freight expenses, inspection labour costs, repackaging overhead, and potential inventory write-downs. When calculating fully loaded SKU contribution margins, estimated return handling costs based on historical return rates for that product category must be deducted from net realisation to reflect true item profitability accurately.
Automating SKU profitability tracking requires integrating your enterprise resource planning (ERP) system, warehouse management software, payment gateway APIs, and digital ad account reporting feeds into a centralised business intelligence dashboard. This connected data architecture automatically calculates fully loaded variable expenses and updates SKU contribution metrics in real time.
Allowing un-audited, low-velocity SKUs to tie up working capital and degrade marketing returns is an expensive operational failure that restricts retail growth. At 1FourOne, we eliminate financial blind spots by deploying a structured sku profitability analysis framework that maximises inventory capital allocation and net contribution cash flow. Contact our growth operations team today to secure a data-driven catalogue audit tailored for your business.
Get your competitive audit in 48 hours and see exactly where your revenue is leaking.
Get Your Audit →