Competitor Ad Audit: 5 Essential Rules for ROAS
Mid-market e-commerce brands running paid customer acquisition campaigns without a competitor ad audit are flying blind on their single largest controllable cost line. Operating digital ad accounts in isolation degrades contribution margins the moment a rival changes tactics, because your shared audience never experiences your campaigns in a vacuum. This guide sets out five essential rules for turning competitor ad transparency data into a disciplined roas optimization process, closing with a worked example showing how much revenue a structured audit can reclaim.
When customer acquisition costs spike, retail teams typically increase bids or cycle through lookalike audiences. This insular strategy fails because it ignores the external creative pressures altering consumer behaviour in real time. Consumers are actively bombarded by rival marketing messages, aggressive discounting models, and highly optimised ad creative strategy frameworks.
If a competitor deploys a highly persuasive positioning angle, your baseline ad performance will degrade instantly. To protect your bottom-line revenue, you must diagnose exactly how rival brands capture the attention of your shared audience. Deploying budget against unverified ad assumptions wastes valuable media spend and introduces systemic risk to your unit economics.
True efficiency requires systematic visibility into rival operations, creative assets, and funnel architectures, in the same way a competitive market share analysis exposes where you are losing traffic to category rivals. A deep analysis of the surrounding digital landscape reveals the exact tactical pivots required to stabilise your return on ad spend. Growth intelligence demands a structured framework that uncovers these external opportunities before your capital is entirely depleted.
A rigorous competitor ad audit identifies the strategic friction points and creative gaps within your active market segment. By mapping the copy formats, visual assets, and landing page patterns of your competitors, your team can avoid expensive trial-and-error testing cycles. This analysis establishes a clear operational baseline for consumer expectations, allowing you to deploy capital only where you hold a distinct competitive advantage.
Context matters here. The median Meta ecommerce ROAS across nearly 35,000 brands sat at 1.93 for 2025, so an account running meaningfully below that is very likely leaking budget to gaps a structured audit would catch. Without this objective intelligence, your ad accounts remain trapped in reactionary optimisation loops.
Uncovering creative saturation points prevents your brand from publishing message profiles that the market already ignores. When multiple market participants run near-identical product hooks, consumer fatigue spikes, and click-through rates plummet across the sector. This process allows your growth teams to spot these visual dead zones, and to deliberately engineer distinct hooks that break through the collective noise of the feed.
Evaluating rival traffic destinations also provides direct insight into their broader technical conversion strategy. Tracking where a competitor directs their paid traffic reveals their product priorities and margin opportunities. If a major competitor diverts budget from standard product pages to dedicated collection bundles, they are actively attempting to increase average order value to absorb rising media costs, recognising these adjustments in real time allows your digital team to deploy counter-strategies to defend your market share.
| Audit Vector | Data Point Tracked | Strategic Interpretation |
|---|---|---|
| Creative Velocity | Weekly volume of unique ad variants published | Indicates scale of active testing and creative resource allocation. |
| Offer Architecture | Prevalence of bundles, sitewide discounts, or tier incentives | Reveals rival margin flexibility and immediate average order value goals. |
| Funnel Destination | Product detail pages vs dedicated custom landing pages | Exposes the sophistication level of rival conversion rate optimisation efforts. |
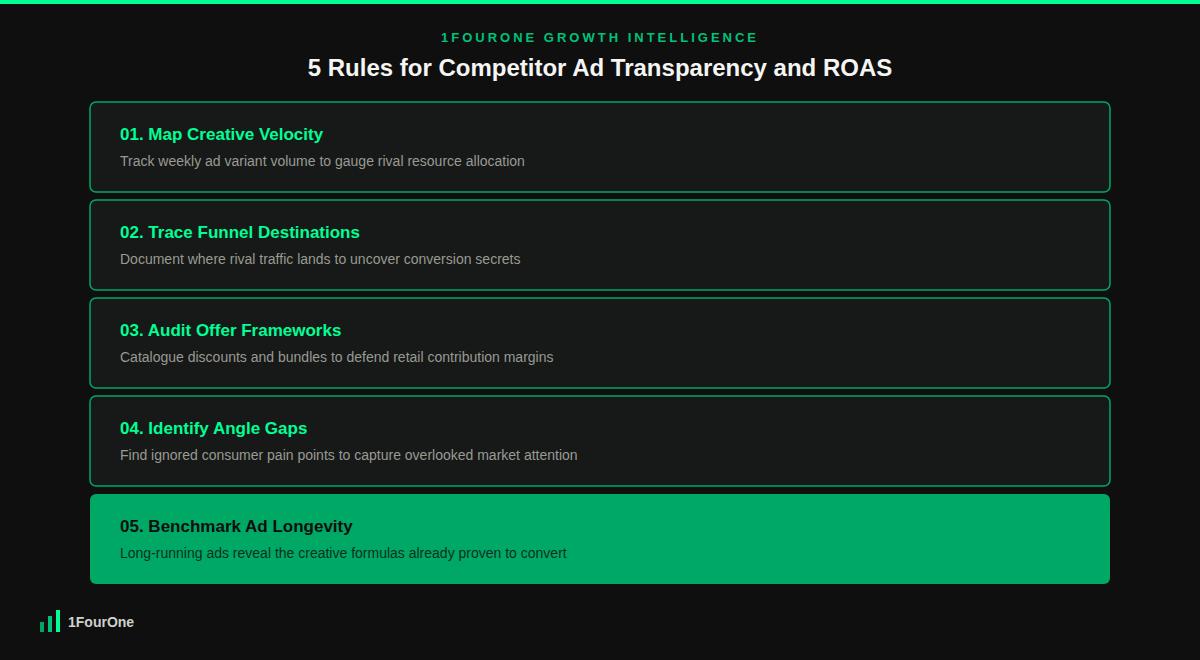
To systematically reclaim your paid media margins, you must turn competitor ad transparency data into internal roas optimization roadmaps. This process requires a shift from qualitative observation to disciplined operational rules. The following five rules provide a structured framework to audit rival accounts, eliminate spend leaks, and maximise the efficiency of your customer acquisition budget.
Creative velocity measures the volume of new visual assets and copy variations an account publishes over a set time window. High creative velocity indicates a structured production pipeline and aggressive testing of new conversion hypotheses. When auditing rival creative, track this metric across your top five immediate rivals. If a competitor launches thirty unique ad variants within a single fortnight, they are moving rapidly to combat creative fatigue.
To match or bypass this operational pace, your internal creative studio must adjust its production output. Compare their volume against your active testing pipeline to expose resource deficits or optimisation bottlenecks. If your team only introduces two new static images a month while rivals rotate dozens of video formats, your account will inevitably suffer from audience ad blindness. Use these velocity benchmarks to justify internal creative asset investments.
An ad is simply the entry point to a broader, multi-stage consumer conversion journey. To extract true value from competitor ad transparency data, click through every active ad variant and document the exact destination URL. Determine whether rivals direct traffic to native product detail pages, collection catalogues, or highly optimised, unindexed landing pages.
Analyse the structural elements of these destination environments, focusing on social proof positioning, pricing structures, and checkout paths, since checkout abandonment is often where a rival’s funnel advantage is actually won or lost. If a rival uses a single-page, friction-free collection layout that outpaces your standard catalogue path, your ad performance will suffer. Rebuild your destination architectures to eliminate the conversion gaps revealed by these competitive insights.
Rival brands constantly adjust their commercial hooks to attract value-conscious digital consumers. This audit process must catalogue every offer format, including standard volume discounts, subscription price drops, and free shipping thresholds. Understanding these financial structures reveals the minimum margin limits your competitors will tolerate, the same discipline behind a sound ecommerce dynamic pricing strategy.
If a primary competitor consistently runs a “Buy Two, Get One Free” hook, they are optimising for volume to secure supply chain efficiencies. Copying this exact strategy without an identical cost structure will damage your balance sheet. Instead, craft value-add alternatives, such as exclusive product pairings or extended warranty inclusions, that counter rival volume plays while protecting your brand equity and unit margins.
Creative saturation occurs when every major sector participant uses the exact same benefit statements or visual styles. If every e-commerce brand in your category relies on basic unboxing videos, consumers will quickly tune out those repetitive assets. This mapping exercise reveals clear creative gaps, and finding an ignored consumer pain point provides an immediate opportunity to capture high-intent market traffic.
Review the primary text blocks and video hook angles across the entire competitive field. If competitors focus exclusively on fast delivery timelines, an explicit angle gap exists around ingredient purity or manufacturing heritage. Directing your ad creative strategy toward these open communication channels reduces ad auction competition, which secures lower click costs and captures highly qualified customer segments.
Digital media buyers do not waste capital on unprofitable creative for extended periods. Any ad variant that remains active for ninety days or more is highly likely generating positive returns. Using competitor ad transparency tools lets you filter rival assets by launch date, which highlights the exact creative formulas that perform best in your specific market.
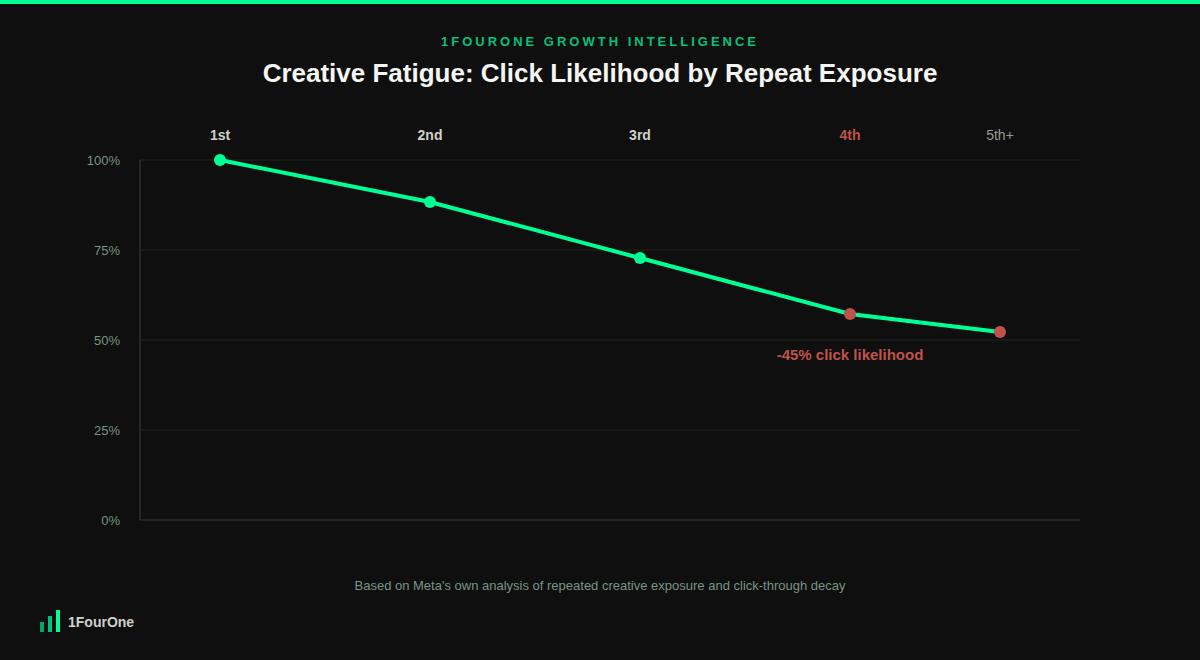
The underlying mechanic is well documented. Meta’s own analysis of ad delivery data found that the likelihood of a click falls by roughly 45% once a user has seen the same creative four times, which is precisely why long-running ads are worth deconstructing.
Do not copy the creative directly, as plagiarism damages your brand equity and triggers platform distribution penalties. Instead, extract the underlying psychological triggers and structural layouts to inform your own production pipeline. This methodical approach forms the baseline of any disciplined, high-performing roas optimization strategy.
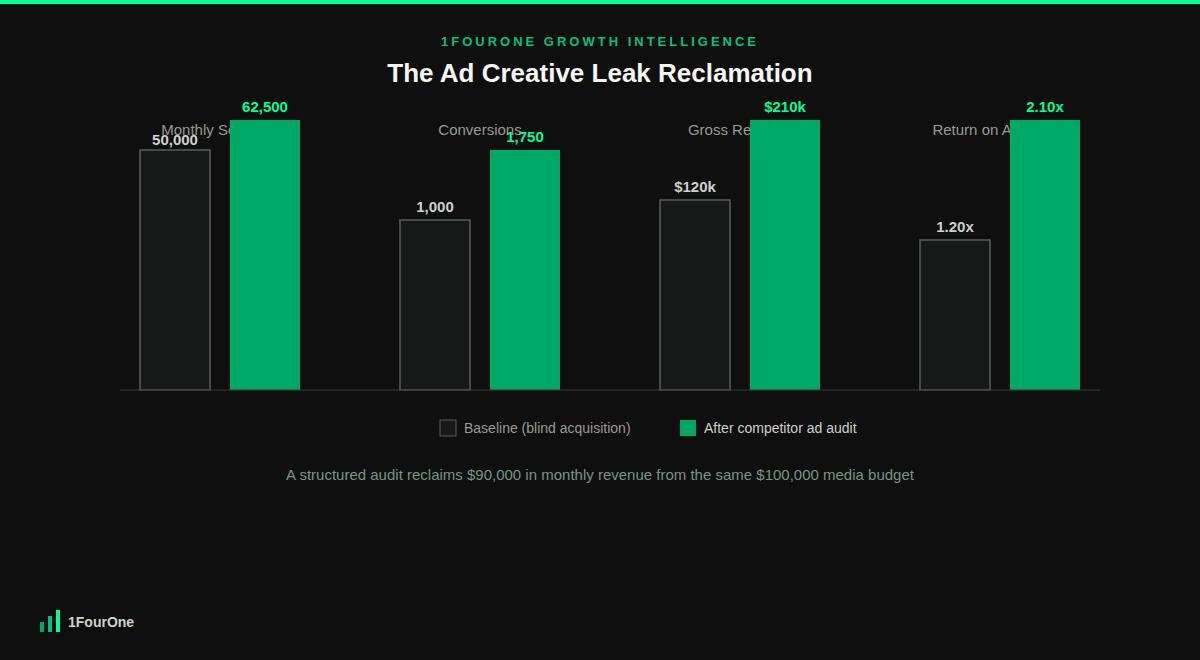
To understand the operational impact of a structured audit, consider a mid-market consumer goods brand operating with a baseline monthly media budget of $100,000. In this baseline scenario, the brand directs all paid traffic to standard product detail pages, achieving an average conversion rate of 2.0%. The baseline cost per click across their paid customer acquisition campaigns sits at $2.00, which yields exactly 50,000 unique monthly sessions ($100,000 media spend divided by $2.00 cost per click).
With 50,000 monthly sessions converting at a baseline rate of 2.0%, the store secures exactly 1,000 completed customer transactions per month. The brand’s average order value is fixed at $120, meaning the total gross revenue generated from this media spend totals $120,000 (1,000 transactions multiplied by $120 average order value). This baseline scenario produces a raw return on ad spend of exactly 1.20 ($120,000 gross revenue divided by $100,000 media spend), well below the 1.93 Meta ecommerce median cited earlier.
The brand then executes a comprehensive competitor ad audit and discovers two major creative leaks in their active customer acquisition campaigns. First, the audit reveals that the top three market rivals are directing traffic to dedicated multi-buy landing pages rather than standard product pages. Second, competitor ad transparency filtering shows that rival ads running for over sixty days use specific problem-centric hooks rather than generic lifestyle imagery. The growth team immediately restructures their ad creative strategy to apply these proven market insights.
The brand launches a dedicated landing page inspired by the competitive data and introduces three targeted problem-centric creative hooks. Because these new creative assets align precisely with unserved consumer pain points, the click-through rate improves, driving the average cost per click down from $2.00 to $1.60. With the monthly media budget remaining flat at $100,000, this improved traffic efficiency increases total monthly site sessions from 50,000 to exactly 62,500 ($100,000 media spend divided by $1.60 cost per click).
Simultaneously, the new dedicated landing page format reduces user confusion and friction, increasing the site conversion rate from 2.0% to 2.8%. Applying this updated 2.8% conversion rate to the expanded traffic volume of 62,500 sessions yields exactly 1,750 completed monthly transactions (62,500 sessions multiplied by 0.028). Assuming the average order value remains stable at $120, the new gross monthly revenue climbs to exactly $210,000 (1,750 transactions multiplied by $120).
These strategic adjustments completely transform the brand’s media unit economics. The final return on ad spend scales from the baseline of 1.20 up to an efficient 2.10, now comfortably above the Meta ecommerce median. This optimisation sprint reclaims $90,000 in monthly revenue previously lost to inefficient traffic paths.
Mid-market retail brands should conduct a comprehensive competitive review every calendar quarter to track macro shifting trends. However, your team should monitor immediate rival creative feeds bi-weekly to capture short-term tactical offer changes and seasonal promotional pivots. Maintaining this regular cadence ensures your internal creative production pipeline remains proactive rather than reactive.
Free platform transparency tools provide an excellent foundational repository for active ad listings, launch dates, and destination URLs. However, they lack advanced aggregation capabilities, such as spend estimates, precise engagement metrics, and historical asset tracking. For deep scale optimisation, combine these free tools with enterprise intelligence platforms to build an actionable dataset.
Major advertising platforms enforce strict transparency mandates that prevent legitimate commercial brands from completely hiding their active digital campaigns. If a rival brand does not appear in standard ad libraries, they are likely using alternative conversion channels like organic search, affiliate partnerships, or direct email networks. Expand your growth intelligence audits to review those alternative acquisition vectors.
You cannot block competitors from viewing your active public ad assets through standard transparency tools. To protect your market position, focus on building proprietary brand equity elements that are incredibly difficult to replicate, such as unique product formulations, exclusive creator partnerships, and superior customer loyalty experiences. Continual creative innovation remains your best structural defence.
Do not pull down active ad campaigns based solely on a competitor’s sudden price adjustment. First, analyse your underlying conversion data to see if your click-through rates or return metrics are actually declining. If your performance remains stable, your target audience is likely prioritising your unique value propositions over cheap alternative pricing models.
Operating paid acquisition channels without deep competitive visibility is a direct threat to your store’s profitability. At 1FourOne, we eliminate the guesswork by executing rigorous, data-driven audits that uncover hidden creative leaks and protect your acquisition margins. Contact our growth operations team today to secure a comprehensive strategic blueprint built for your market.
Get your competitive audit in 48 hours and see exactly where your revenue is leaking.
Get Your Audit →