Your Blended ROAS Looks Fine. One of Your Channels Is Quietly Losing Money.

Executing a structured first party customer data analytics framework is the most vital operational adjustment a mid-market digital retailer can deploy to evaluate true customer profitability as third-party tracking degradation distorts ad platform reporting. Many online brand operators rely on aggregate front-end attribution metrics, completely failing to analyse how different customer acquisition channels perform across multi-month trading horizons. Evaluating paid marketing campaigns on immediate initial order volume obscures backend cohort churn, leading businesses to fund unprofitable customer growth. Transitioning to a server-side cohort analytics model enables growth teams to isolate high-value customer segments, eliminate wasteful ad channels, and build compounding cash flow.
Modern e-commerce operations frequently suffer from poor media capital allocation caused by an over-reliance on blended channel metrics. Standard advertising dashboards present aggregate return on ad spend numbers that mask deep performance discrepancies between different acquisition sources. A marketing channel may generate high initial transaction volume at a low upfront cost, but if those buyers never place a secondary order, the channel delivers poor long-term value. Managing media spend without cohort-level visibility exposes your balance sheet to hidden capital drains.
Operating a digital store without tracking backend customer behaviour by acquisition source creates severe structural vulnerabilities. When acquisition budgets are distributed evenly based on top-line conversion counts, media buyers end up subsidising acquisition channels that attract low-intent, discount-seeking buyers. These single-purchase cohorts absorb significant customer support overhead and fulfilment resources while generating zero repeat margin. Over time, funding low-quality customer acquisition compresses net operating margins and restricts liquid working capital.
To establish a resilient retail operation, executives must evaluate acquisition efficiency through multi-month cohort tracking. Analysing how specific customer cohorts generate contribution profit over 30, 90, and 365 days allows growth teams to identify true profitability drivers. Shifting from initial transaction reporting to deep first-party cohort analytics ensures that advertising capital is directed exclusively toward channels that build enduring enterprise value.
Building a defensible e-commerce business requires far deeper analytical rigor than surface-level sales totals can provide. Incorporating server-side cohort analytics into your broader growth intelligence matrix enables commercial teams to measure net contribution profit across the entire customer lifecycle. By linking specific ad creative, landing pages, and acquisition campaigns to long-term repeat order velocity, analysts can establish accurate channel payback benchmarks. This financial clarity prevents businesses from over-investing in low-quality traffic channels.
Capturing server-validated customer data directly also protects your marketing spend efficiency against external platform data loss. As web browsers restrict client-side tracking scripts, ad platform attribution panels become increasingly unreliable, often claiming credit for duplicate or non-incremental orders. Building an internal data pipeline to track customer behaviour independently provides an unvarnished view of campaign performance, ensuring that media spend decisions reflect true backend profitability and genuine marketing spend efficiency rather than an inflated dashboard figure.
Validating cohort analytics against established empirical business research underscores its commercial importance. Published research by the Harvard Business Review confirms that increasing customer retention rates by 5% scales overall corporate profits by 25% to 95%. This empirical baseline shows why identifying high-retaining customer cohorts through server-side analytics yields substantial financial returns, releasing capital to fund sustainable business growth.
| Cohort Analysis Layer | Primary Data Variable | Operational Optimisation Goal |
|---|---|---|
| Channel Profitability Tracking | 90-day net contribution profit by acquisition source | Reallocating media spend away from high-churn traffic channels. |
| First-Purchase Basket Profiling | Initial SKU category and basket item count | Identifying entry products that correlate with high repeat purchase rates. |
| Repurchase Velocity Mapping | Time elapsed between first and second transaction | Triggering automated re-engagement workflows before accounts lapse. |
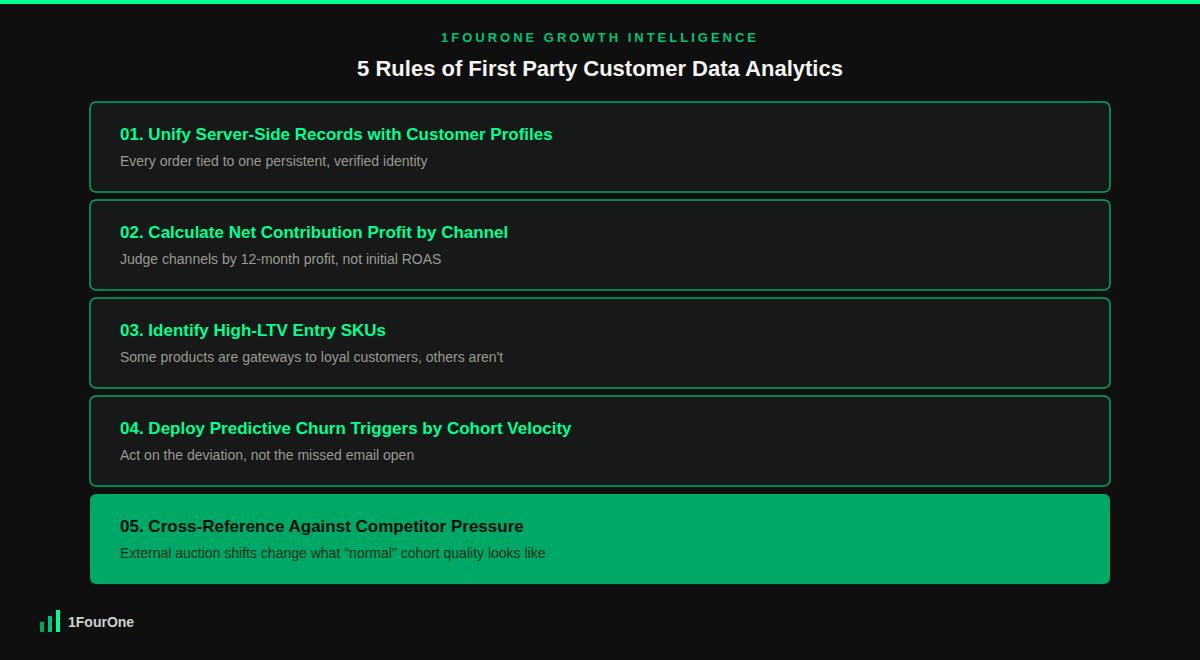
To systematically isolate high-value customer cohorts and eliminate wasted media spend, your analytics team must institutionalise this discipline across all sales channels. This operational approach replaces speculative attribution modelling with disciplined, server-validated cohort tracking. The following five rules provide a repeatable methodology to analyse cohort profitability, improve ad platform targeting, and elevate customer lifetime value.
The primary foundation of accurate cohort analytics is establishing a unified server-side data pipeline that links every online transaction directly to a persistent customer profile. Relying on browser-based tracking pixels to monitor customer journeys leads to missing event data and broken attribution paths. Building a server-to-server data collection framework ensures that every order, refund, and customer support interaction is recorded accurately.
Configure your data infrastructure to hash customer email identifiers and attach persistent internal customer keys to every order record. Integrate these server-validated transaction logs directly with your broader ecommerce first party data strategy pipeline. Unifying backend transaction records with customer profiles provides an accurate dataset for analysing long-term cohort behaviour and calculating true channel profitability.
Evaluating advertising channels based on top-line gross revenue generated on initial orders is a common operational mistake that masks capital waste. A channel that delivers high transaction volume at a low initial cost may actually generate net contribution losses once fulfilment expenses, merchant fees, and high refund rates are accounted for. Operations teams must calculate fully loaded contribution profit by channel.
To implement this control, calculate net contribution profit for every acquisition cohort at 30, 90, and 365 days post-acquisition, deducting COGS, fulfilment fees, return costs, and initial ad spend. As outlined in our strategic guide on acquisition channel prioritisation 5 rules, reallocating ad budgets toward channels that demonstrate strong multi-month contribution margins optimises overall capital efficiency. Cutting spend to channels with negative multi-month margins instantly releases operating cash flow.
Analysing customer cohorts based on their initial entry product reveals that specific items in your catalogue act as powerful drivers of long-term brand loyalty. Customers who enter your brand ecosystem through high-utility flagship products often exhibit significantly higher repeat purchase rates than those who enter through heavily discounted promotional items. Identifying these high-LTV gateway products enables marketing teams to refine ad campaigns.
Analyse historical cohort retention data to identify the top 20% of SKUs that correlate with repeat order velocity. Structure your paid customer acquisition campaigns around these proven entry products, avoiding ad spend on items that attract single-purchase buyers. As detailed in our operational guide on how to reduce checkout abandonment tactics, pairing high-value entry products with seamless checkout flows maximises both conversion velocity and long-term cohort value.
Waiting for a customer cohort to stop opening marketing emails before attempting re-engagement is a reactive tactic that yields low recovery rates. Server-side analytics tools must monitor cohort purchase intervals to identify when an account’s time-since-last-order exceeds its historical cohort average. Detecting subtle drops in engagement velocity enables automated systems to trigger timely interventions.
Configure automated email and SMS workflows that fire when an individual customer’s order interval exceeds their cohort’s median repurchase window by 25%. To keep these interventions genuinely useful rather than generic spam, benchmark your win-back messaging against the international guidelines in ISO 10004:2018. Incorporate process parameters from our framework on predictive churn audit rules to structure effective win-back offers and product usage guides. Re-engaging customers before they lapse preserves valuable account relationships and protects long-term customer lifetime value metrics.
External competitive activity in paid advertising auctions can significantly impact the initial quality and retention behaviour of acquired customer cohorts. If an aggressive competitor launches a heavy promotional campaign targeting your primary keywords, your initial acquisition costs may spike while acquired cohort quality drops. Analytics teams must monitor rival advertising strategies alongside internal cohort performance.
Continuously track competitor ad creative, pricing shifts, and promotional offers across major media networks. As outlined in our strategic breakdown of competitor ad audit 5 rules, tracking rival promotional strategies allows you to adjust bidding parameters proactively when auction competition threatens campaign margins. Aligning internal cohort tracking with competitive intelligence ensures that media capital is protected during high-competition market cycles.
To evaluate the direct commercial impact of first party customer data analytics, let us examine an established digital retailer spending $300,000 per quarter on paid customer acquisition to generate 3,000 new customers ($100 blended Customer Acquisition Cost). On initial orders averaging $120 with a 40% gross margin ($48 gross profit), the company recovers $144,000 in initial gross profit. Without cohort tracking, ad budgets are split evenly across three acquisition channels ($100,000 per channel to acquire 1,000 buyers each), and the business reports a healthy blended return on the campaign overall.
Deploying server-side cohort analytics reveals severe backend performance discrepancies hiding underneath that healthy-looking blended figure. Channel A yields high-quality buyers with a 12-month repeat order rate of 60% ($120 average repeat gross profit per customer), delivering $168,000 in total 12-month gross profit ($48 initial plus $120 repeat, multiplied by 1,000 buyers). Channel B yields a 20% repeat rate ($40 repeat profit), generating $88,000 in total 12-month gross profit. Channel C yields a 5% repeat rate ($10 repeat profit), generating only $58,000 in total 12-month gross profit.
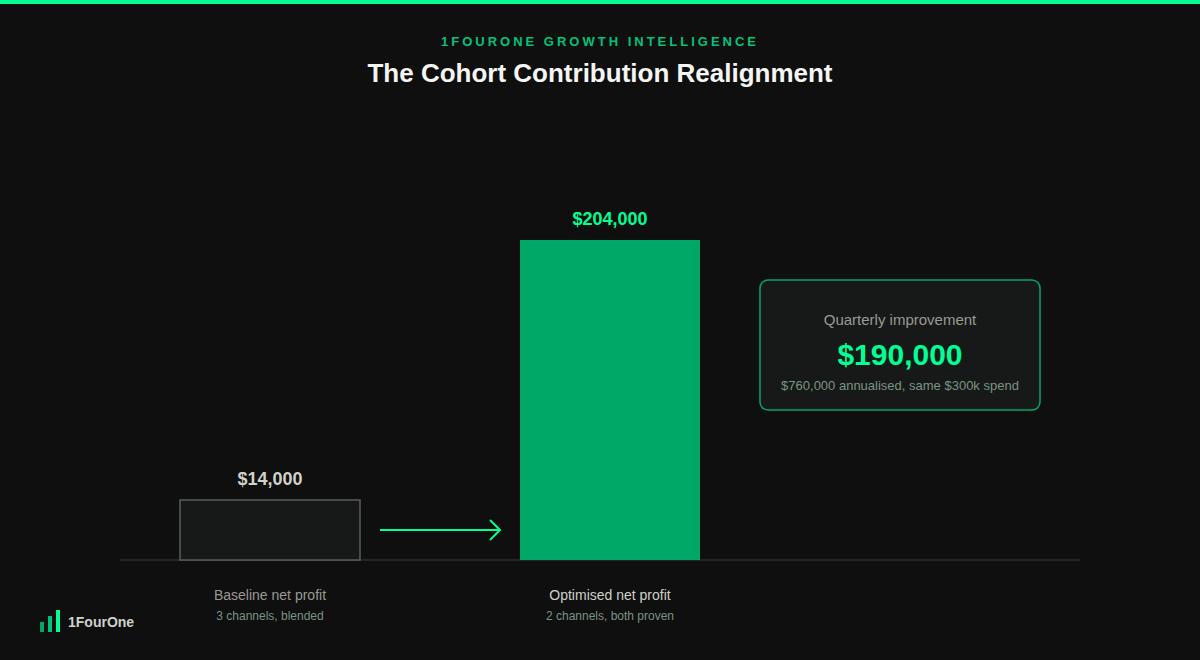
Combined, the three channels generate $314,000 in gross profit against $300,000 in spend, a modest $14,000 net profit that conceals the real picture entirely.
Examined individually, only Channel A is actually profitable on its own $100,000 spend, returning $68,000 in net contribution ($168,000 profit minus $100,000 spend). Channel B is quietly loss-making, returning negative $12,000 net ($88,000 profit minus $100,000 spend), and Channel C is severely loss-making at negative $42,000 net ($58,000 profit minus $100,000 spend). Channel A’s strength has been single-handedly subsidising two structurally unprofitable channels, masking the true state of the acquisition portfolio behind a blended figure that looked acceptable.
The brand’s growth operations team cuts spend entirely to both Channel B and Channel C, freeing up $200,000 in quarterly media budget. They redirect $100,000 of this into Channel A, scaling it to 2,000 buyers per quarter, and commit the remaining $100,000 to a newly tested high-intent search channel, acquiring 1,000 buyers who exhibit the same 60% repeat rate and $168 total 12-month gross profit per customer as Channel A’s existing audience. Total quarterly acquisition spend remains unchanged at $300,000, and total buyer volume remains unchanged at 3,000.
This data-driven reallocation transforms overall cohort profitability. Channel A’s total 12-month gross profit scales to $336,000 (2,000 buyers multiplied by $168), and the new search channel contributes $168,000 (1,000 buyers multiplied by $168). Combined 12-month gross profit reaches $504,000, against the same $300,000 in quarterly spend, a net profit of $204,000. Measured against the true baseline net profit of $14,000, this represents a $190,000 improvement per quarterly cohort achieved without increasing total acquisition spend or buyer volume, purely by redirecting capital away from two channels that cohort analytics revealed were quietly destroying value.
The financial return from this cohort analytics program is immediate and highly transformational for corporate cash flow. This $190,000 quarterly profit improvement compounds to $760,000 in annualised profit expansion across four quarterly cohorts, providing substantial liquid capital to fund ongoing business growth securely.
Single-touch attribution credits a transaction to a single marketing touchpoint recorded immediately before or shortly after checkout, ignoring long-term customer behaviour. Multi-month cohort tracking groups customers by their initial acquisition time and source, following their cumulative order history and contribution margin over extended timeframes. This is the core discipline that first party customer data analytics is built on, and it provides an accurate view of long-term customer quality and channel profitability that blended attribution simply cannot.
Ad platform dashboards overreport returns because they rely on client-side tracking pixels, use generous attribution windows, and claim full credit for transactions touched by their ads, regardless of whether the ad was the primary driver of purchase intent. Ad platforms also cannot track backend cancellations, refunds, or fulfilment costs, leading to inflated initial profit metrics that obscure true campaign economics.
Digital retailers should track cohort behaviour over a minimum 60-to-90-day window before making major media allocation adjustments. A 90-day window captures initial repeat order patterns, providing sufficient data to identify high-performing acquisition channels without delaying budget reallocations unnecessarily. For seasonal or low-frequency product categories, extending cohort tracking to 180 days ensures accurate LTV calculations.
Calculate net contribution profit for an acquisition cohort by summing all gross revenue generated by the cohort over a specific timeframe, then subtracting cumulative COGS, variable fulfilment fees, merchant processing charges, return handling costs, and initial media acquisition spend. The resulting net dollar figure represents the true cash profit the cohort has contributed to covering fixed corporate overheads.
Yes, segmenting customer cohorts by their initial entry product reveals which SKUs correlate with high repeat purchase rates and long-term customer retention. Products that solve immediate customer needs or offer high utility consistently yield cohorts with higher repeat order velocity. Identifying these gateway SKUs enables marketing teams to focus acquisition campaigns on products that build enduring brand value.
Allowing unvalidated attribution metrics to guide acquisition spending is an expensive operational failure that degrades retail profitability. At 1FourOne, we eliminate financial blind spots by deploying first party customer data analytics frameworks that isolate high-value customer segments and maximise net contribution cash flow. Contact our growth operations team today to secure a data-driven customer data audit tailored for your business.
Get your competitive audit in 48 hours and see exactly where your revenue is leaking.
Get Your Audit →