Cutting Returns From 20% to 12% Saved This Retailer $34,000 a Month
Executing a comprehensive ecommerce return rate reduction framework is the most vital operational adjustment an online retail business can deploy to eliminate reverse logistics margin erosion and protect net operating profits across complex product categories. Many digital brand operators treat high product return rates as an unavoidable cost of doing business, completely failing to calculate how double shipping fees, inspection labour, and inventory write-downs degrade cash flow. Allowing unmonitored return volumes to accumulate across regional fulfilment centres quietly drains contribution margins and inflates customer acquisition costs. Transitioning to a proactive ecommerce return rate reduction strategy enables growth teams to optimise product display accuracy, protect marketing spend efficiency, and build compounding cash flow.
Modern e-commerce enterprises frequently suffer severe financial compression caused by unexamined product return cycles. When a customer initiates a product return, the business absorbs duplicate shipping expenses, paying for both initial outbound delivery and return freight back to the warehouse. Once returned items arrive at fulfilment facilities, warehouse teams incur secondary labour costs to inspect, clean, and re-tag items before re-entering them into active inventory, creating a substantial operational overhead.
Operating a storefront with high return rates introduces severe financial risk across a corporate balance sheet. In categories like apparel, footwear, and complex home goods, return rates routinely range between 20% and 35%, creating massive inventory velocity bottlenecks. A significant portion of returned stock cannot be resold at full retail price due to damaged packaging or minor wear, forcing brands to liquidate items at steep discounts or write off inventory value entirely, directly eroding unit margins.
To establish a defensible commercial enterprise, growth executives must evaluate reverse logistics as a primary operational target. Understanding the fully loaded cost of every returned item allows product, supply chain, and marketing teams to implement pre-purchase sizing and specification controls. Shifting from reactive return processing to proactive ecommerce return rate reduction ensures that net sales realisation reflects true operating profitability.
Building a scalable digital retail operation requires far deeper analytical rigour than simple gross revenue tracking can supply. Incorporating return rate auditing into your broader growth intelligence matrix enables commercial teams to evaluate net contribution yield by product line, traffic source, and customer cohort. By identifying specific SKUs or acquisition channels that generate high return rates, managers can adjust product detail pages or refine media targeting. This analytical oversight keeps ecommerce return rate reduction focused on the SKUs and channels that turn customer volume into reverse logistics losses.
Ecommerce return rate reduction also directly supports your paid customer acquisition strategy. When return volume is minimised, net contribution profit per conversion increases substantially, restoring the gross margin buffer needed to fund paid customer acquisition campaigns. Lowering reverse logistics expenses allows media buyers to maintain competitive ad bidding without generating net order losses across primary growth channels.
Validating return reduction initiatives against established empirical business research underscores its commercial importance. Published research by the Harvard Business Review confirms that increasing customer retention rates by 5% scales overall corporate profits by 25% to 95%. This empirical baseline demonstrates why ecommerce return rate reduction through accurate product expectations and frictionless exchange alternatives preserves customer satisfaction, generating the reliable cash flow required to support long-term customer lifetime value.
| Return Driver | Primary Operational Cost | Return Reduction Action |
|---|---|---|
| Incorrect Sizing / Fit Expectation | Round-trip freight fees and inspection labour | Deploying 3D sizing recommenders and customer fit review filters. |
| Customer “Bracketing” Behaviour | High inventory lockup and multi-item return freight | Applying dynamic restocking fees on multi-size duplicate orders. |
| Refund Cash Defection | Permanent loss of initial order gross margin | Incentivising store credit exchanges with bonus value credits. |
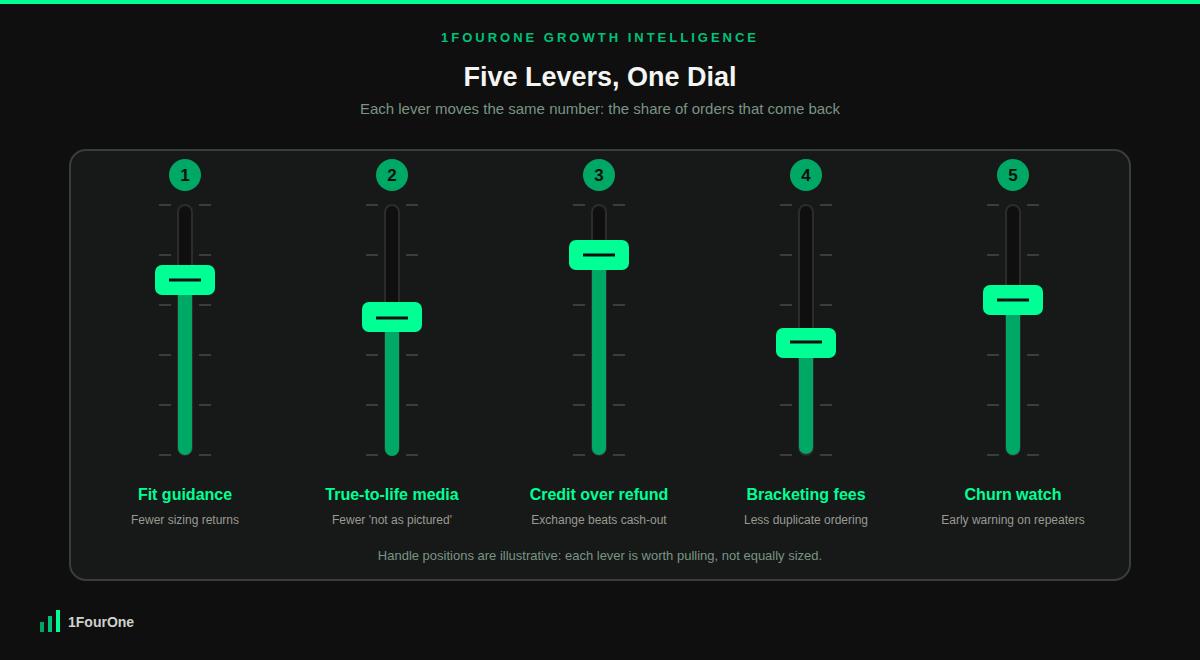
To systematically eliminate reverse logistics leaks and protect net operating margins, your commercial team must institutionalise a structured ecommerce return rate reduction framework across all storefront touchpoints. This operational approach replaces passive return handling with active, pre-purchase expectation setting and exchange-first portal mechanics. The following five levers provide a repeatable methodology to audit return sources, protect marketing spend efficiency, and recover net cash flow.
The primary driver of e-commerce returns in apparel, footwear, and apparel-adjacent categories is sizing uncertainty and inaccurate fit expectations. When shoppers struggle to determine their correct size, they either abandon their cart or purchase multiple sizes of the same item with the intention of returning those that do not fit, a practice known as bracketing. Sizing uncertainty drives high return rates across online storefronts.
Integrate interactive 3D sizing recommenders, accurate garment measurement charts, and user-generated fit feedback modules on product pages. Coordinate these product page tools with inventory rules from our operational guide on inventory allocation strategy rules. Providing precise fit guidance before purchase resolves buyer hesitation and delivers ecommerce return rate reduction where sizing is the main cause of returns.
A frequent cause of product returns across home goods, accessories, and technical products is discrepancy between online product photos and physical item appearance. High-studio lighting, colour alteration, and lack of scale reference can mislead shoppers regarding true product texture, colour tone, or dimensions. When physical items fail to match online expectations, return requests follow quickly.
Enhance product detail pages with unedited 4K video demonstrations, 360-degree product rotators, and natural-light scale comparisons. Syncing visual assets with dynamic commercial pricing rules, as outlined in our strategic guide on ecommerce dynamic pricing strategy, sets accurate product value expectations. Clear visual representations align buyer expectations with physical products, which makes ecommerce return rate reduction easier on misrepresentation returns.
Allowing return portals to process instant cash refunds by default results in permanent loss of acquired customer gross margin and forces the business to absorb return freight costs. When a customer elects a cash refund, the initial customer acquisition spend is wasted. Return flows should prioritise customer retention by making product exchanges and store credit options more attractive.
Structure automated return portals to offer a $10 to $15 bonus credit incentive when buyers choose store credit or variant exchange over a cash refund. As detailed in our strategic guide on competitor ad audit 5 rules, optimising offer structures protects overall campaign returns. Incentivising store credit complements ecommerce return rate reduction by keeping the sale even when an item does come back, while covering return processing fees.
Allowing shoppers to order three or four size variations of the same product without penalty encourages wasteful bracketing behaviour that ties up inventory and generates high return shipping expenses. While offering free returns on single items supports conversion, subsidising multi-item bracketing orders severely damages unit economics. Operations teams must introduce friction into intentional bracketing behaviour.
Implement dynamic cart rules that identify multi-size orders of identical SKUs and apply clear restocking fee disclaimers for returned items within bracketing orders. As documented in our operational guide on how to reduce checkout abandonment tactics, transparent policy communication preserves checkout velocity. Dynamic restocking fees disincentivise excessive bracketing, which makes them a direct tool for ecommerce return rate reduction, while recovering return handling costs.
Evaluating return rate reduction based purely on short-term shipping savings ignores the underlying customer satisfaction signals embedded in return data. A customer who experiences repeated fit issues or receives damaged items is at high risk of churning from your brand permanently. Operations teams must link return portal events directly to customer retention workflows.
Track return frequency by customer profile and route accounts with multiple return requests to specialised customer care workflows. Align post-purchase satisfaction monitoring with international quality guidelines in ISO 10004:2018. Incorporating process parameters from our framework on predictive churn audit rules ensures proactive intervention before customer dissatisfaction leads to permanent account churn, protecting customer lifetime value.
To evaluate the direct commercial return of an ecommerce return rate reduction program, let us examine an established online apparel retailer processing 20,000 orders per month at $100 Average Order Value ($2,000,000 gross monthly sales). Product COGS is 35% of order value ($35 per order, or $700,000 in total), paid acquisition spend is $300,000 ($15 per order), and outbound fulfilment and shipping totals $200,000 ($10 per order). Outbound shipping is paid on every order whether or not it comes back, so the return costs below count only what a return adds on top.
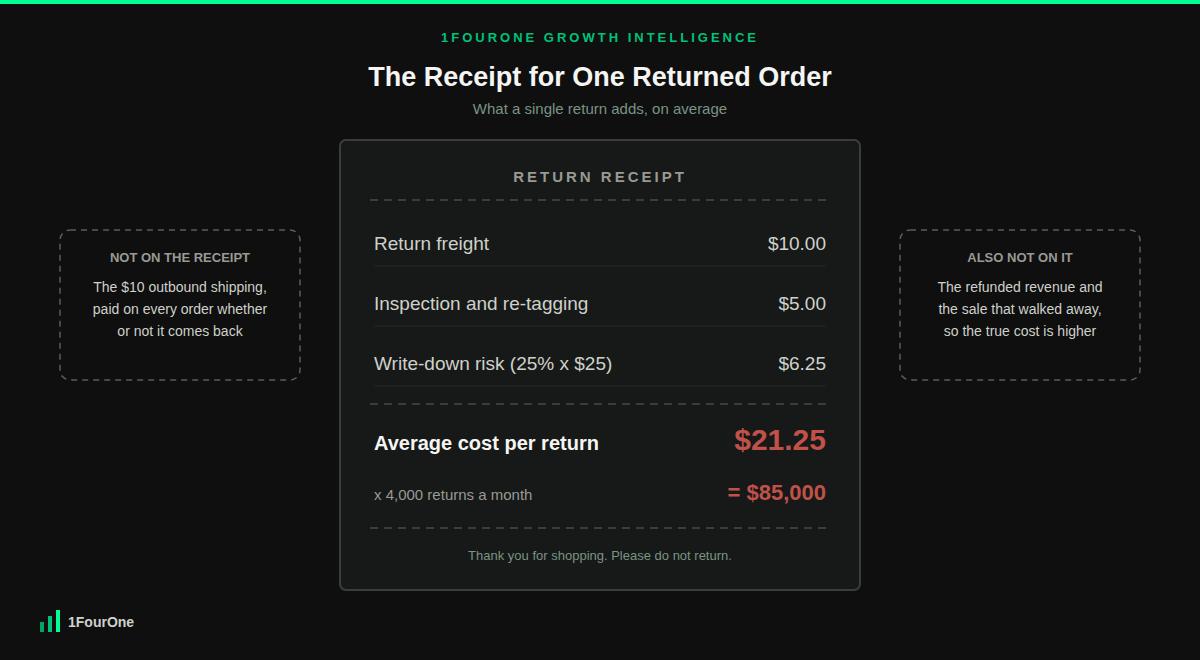
Reviewing fulfilment analytics uncovers a severe reverse logistics margin leak: an unmonitored 20% return rate means 4,000 returned orders every month. Return freight costs $10 per returned order ($40,000), warehouse inspection and re-tagging adds $5 per returned unit ($20,000), and 25% of returned stock (1,000 units) cannot be resold as new, producing a $25 per-unit liquidation loss ($25,000). Total return-related expenses reach $85,000 a month, an average of $21.25 for every returned order.
Because gross sales are held at $2,000,000 in both states, the comparison isolates return handling costs and leaves refunded revenue out. On that basis, baseline contribution profit is $715,000 ($2,000,000 sales minus $700,000 COGS minus $300,000 ad spend minus $200,000 outbound shipping minus $85,000 return costs).
The brand’s growth operations team executes a comprehensive ecommerce return rate reduction program. They deploy 3D interactive sizing recommenders on product detail pages, upgrade product media to include unedited 4K fabric videos, offer a store credit bonus for exchanges inside the return portal, and apply targeted restocking fees to multi-item bracketing orders.
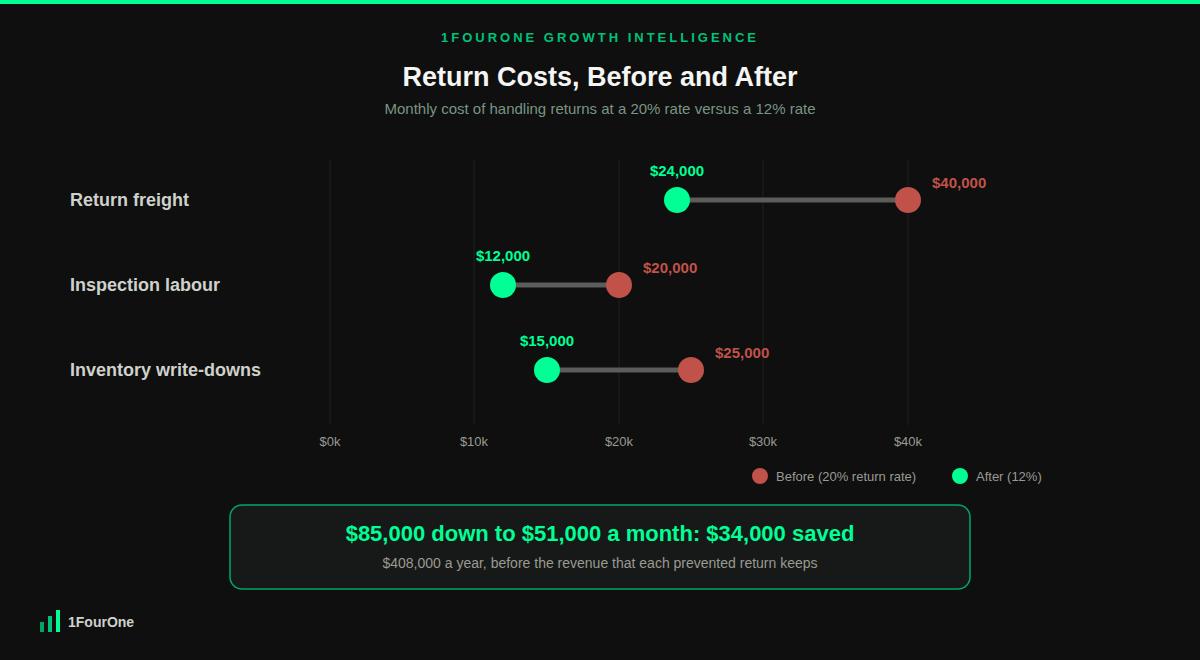
This operational intervention transforms reverse logistics metrics. The overall return rate drops from 20% down to 12%, which is 2,400 returned orders per month and a reduction of 1,600 returns. Half of the remaining returns, 1,200 orders, convert into store credit exchanges instead of cash refunds.
Return freight falls to $24,000 (2,400 × $10), inspection labour falls to $12,000 (2,400 × $5), and write-downs fall to $15,000 (25% of 2,400 returned units, or 600 units, at $25). Combined monthly return expenses drop from $85,000 down to $51,000, a saving of $34,000.
The financial return from this reverse logistics program is immediate and highly sustainable. On flat $300,000 marketing acquisition spend and identical gross sales ($2,000,000), contribution profit expands from $715,000 up to $749,000. The business secures a $34,000 monthly profit reclamation ($408,000 annualised cash flow expansion) from return rate reduction and reverse logistics governance without increasing advertising budgets.
Three points on how this example is built are worth stating plainly. It leaves refunded revenue out of both states, so it understates the gain, because every prevented return also keeps a sale worth about $65 in gross margin. It also excludes the cost of the store credit bonus, which at $15 across 1,200 exchanges would be $18,000, and it applies the same 25% write-down rate to exchanged returns because those items still come back and still need inspection. Model the credit alongside the retained revenue before committing to the incentive.
Average e-commerce product return rates vary significantly by category, ranging from 8% to 15% for hard goods and electronics, up to 20% to 35% for apparel, footwear, and fashion accessories. Return rates exceeding 25% indicate significant sizing confusion, product representation gaps, or unmonitored customer bracketing behaviour that requires operational intervention. Benchmarking your own rate against these ranges is the first step in any ecommerce return rate reduction effort.
Customer bracketing, which means ordering multiple size or colour variations of the same item with the intention of returning most of them, impacts warehouse costs by locking up inventory depth, increasing outbound and inbound shipping expenses, and inflating inspection labour. Bracketing multiplies warehouse handling steps per customer transaction, directly eroding unit contribution margins.
An automated return portal encourages store credit by presenting store credit and instant variant exchanges as the primary, default options in the return workflow. Offering immediate bonus store credit (such as a $10 bonus credit) or waiving return shipping fees for exchanges incentivises buyers to retain their transaction value with your brand.
Yes, charging restocking fees is legal in most jurisdictions, provided the restocking fee policy is clearly disclosed to customers prior to purchase, such as on product detail pages and during checkout. Restocking fees help recover warehouse inspection labour and repackaging costs incurred when handling returned items. Rules differ by country, and faulty goods usually cannot attract a fee, so confirm your policy with local consumer-law advice before publishing it.
Improving sizing accuracy on product pages drives ecommerce return rate reduction by providing clear garment measurements, 3D body fitting recommendations, and real customer fit feedback. Giving shoppers precise sizing guidance eliminates sizing guesswork, decreases order bracketing behaviour, and ensures delivered items match customer expectations upon unboxing.
Track four numbers together: return rate by SKU, cost per return (about $21.25 in the example above), exchange conversion, and the repeat purchase rate of customers who returned. Successful ecommerce return rate reduction lowers the first two without hurting the last two, so a falling return rate that also drives away repeat buyers is not a win.
Allowing unmonitored return rates and reverse logistics costs to erode net contribution margins is an expensive operational failure that degrades retail profitability. At 1FourOne, we eliminate supply chain leaks by deploying a disciplined ecommerce return rate reduction framework that optimises product accuracy and maximises net cash flow. Contact our growth operations team today to secure a data-driven return audit tailored for your business.
Get your competitive audit in 48 hours and see exactly where your revenue is leaking.
Get Your Audit →