The Hidden Cost of Making Customers Wait Five Months to Pay for Themselves
Executing a disciplined cac payback period optimisation framework is the most vital operational adjustment a mid-market e-commerce business can deploy to release trapped working capital when ad auction costs scale across digital media networks. Many online retail operators focus exclusively on top-line transaction volume, completely ignoring how many months of customer trading are required to recover initial acquisition expenses. Long payback windows severely restrict corporate liquidity, forcing brands to borrow expensive working capital simply to fund ongoing paid marketing campaigns. Transitioning to a data-driven payback velocity model enables growth teams to shorten capital recovery cycles, protect net operating margins, and build a self-funding acquisition engine.
Digital retail enterprises frequently suffer from cash flow bottlenecks caused by slow capital recovery across paid customer acquisition channels. When a business pays $100 to acquire a new buyer but only generates $30 in net contribution profit on the initial transaction, the remaining $70 of media spend must be recovered through future repeat orders. If those repeat purchases take six to twelve months to materialize, marketing capital remains locked up in unrecovered acquisition debt. Operating with extended payback timelines severely limits operational agility.
Managing an e-commerce operation without tracking payback velocity introduces severe financial vulnerability into a corporate balance sheet. When digital ad costs increase, front-end contribution margins compress, pushing payback timelines further into the future. If a brand continues scaling paid ad budgets under extended payback conditions, it creates a widening cash flow deficit that consumes liquid cash reserves. This structural friction forces executives to pause marketing campaigns or secure external financing to bridge liquidity gaps.
To establish a resilient commercial model, retail executives must evaluate marketing efficiency through the lens of capital velocity. Understanding the exact time required to break even on acquisition costs allows growth teams to optimise media spend based on real cash recovery rates. Shifting focus from distant multi-year customer values to rapid payback velocity ensures that paid customer acquisition campaigns generate sufficient cash flow to fund ongoing business operations.
Building a defensible digital retail model requires far deeper financial analysis than surface-level return metrics can provide. Incorporating capital recovery timelines into your broader growth intelligence framework enables commercial teams to measure how quickly marketing expenditures return to the balance sheet. By mapping initial basket gross margins and early repeat purchase intervals against upfront media costs, managers can establish strict payback limits for every advertising channel. This financial oversight prevents businesses from funding unsustainable customer growth.
Relying on long payback windows also becomes increasingly hazardous as customer retention rates fluctuate across digital sales channels. If a marketing channel yields buyers who churn before reaching their breakeven point, the business absorbs a permanent capital loss on those customer accounts. Protecting long-term customer lifetime value metrics requires ensuring that initial customer orders cover a substantial portion of upfront acquisition costs, reducing financial exposure if subsequent customer retention rates decline.
Validating payback metrics against empirical business research is essential to maintain long-term financial health. Published research by the Harvard Business Review confirms that increasing customer retention rates by 5% scales overall corporate profits by 25% to 95%. This empirical baseline shows why accelerating post-purchase order velocity to shorten payback cycles yields substantial financial returns, releasing working capital to support business expansion.
| Payback Metric Layer | Primary Financial Risk | Capital Velocity Action |
|---|---|---|
| First-Order Margin Coverage | Low initial basket value failing to cover upfront media spend | Deploying pre-purchase bundle offers to elevate initial gross profit. |
| 60-Day Repeat Repurchase Velocity | Slow secondary order velocity extending payback timelines | Triggering automated replenishment workflows during early trading. |
| Unhedged Channel Allocations | Scaling ad channels with extended capital recovery cycles | Reallocating ad spend toward acquisition networks with rapid payback. |
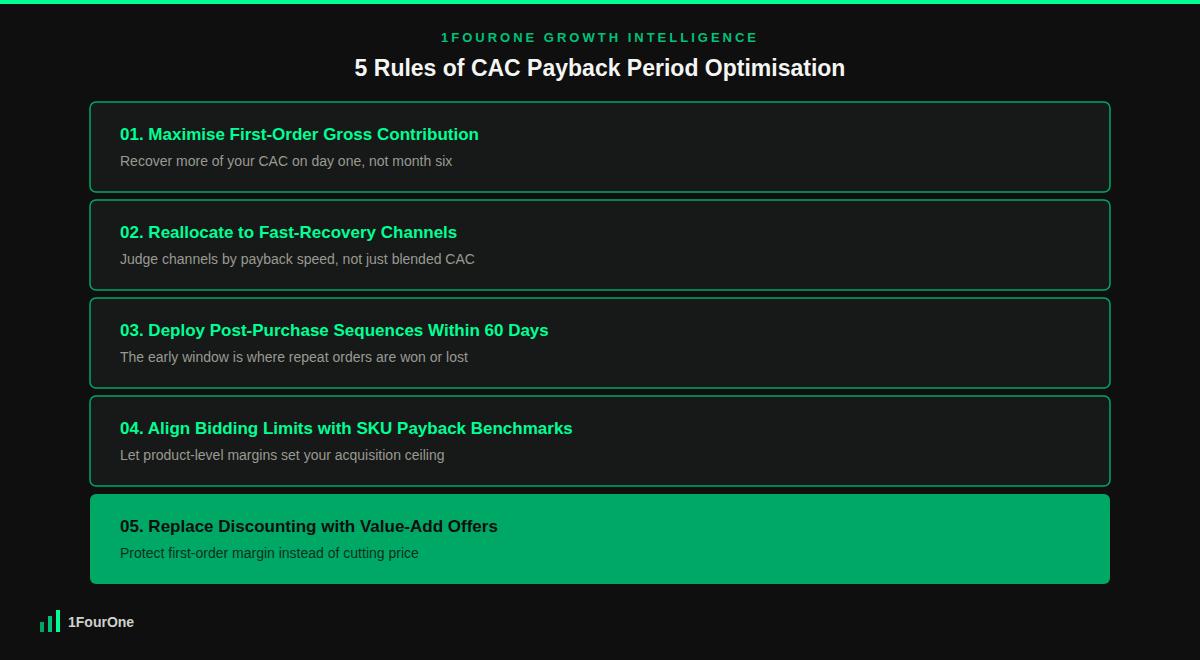
To systematically contract capital recovery timelines and eliminate media spend waste, your operations team must institutionalise a structured cac payback period optimisation strategy across all acquisition channels. This operational framework replaces speculative long-term revenue projections with disciplined, cash-focused campaign management. The following five rules provide a repeatable methodology to accelerate payback velocity, improve marketing spend efficiency, and protect operating cash flow.
The fastest way to shorten a customer payback window is increasing the net contribution margin generated on the initial order. Allowing customers to purchase single low-margin items on their first order leaves the business with a large unrecovered acquisition debt that requires multiple repeat orders to clear. Structuring initial purchase offers to drive higher basket values ensures that a larger portion of upfront media spend is recovered immediately.
To execute this rule, design high-value starter bundles, multi-pack kits, and intelligent cross-sell recommendations directly within the initial purchasing path. As detailed in our operational guide on how to reduce checkout abandonment tactics, optimising initial order value while maintaining low checkout friction elevates first-order gross profit. Generating higher initial contribution margin dollars directly reduces unrecovered acquisition spend, accelerating your overall payback timeline.
Treating all paid advertising channels as equal based on blended acquisition costs is a common operational mistake that masks capital inefficiency. Different advertising channels attract customer cohorts with distinct initial basket sizes and repeat purchasing habits. An ad channel with a higher upfront customer acquisition cost may actually deliver a shorter payback period if its buyers convert on high-value bundles or repeat quickly.
Your analytics team must calculate payback timelines independently for every marketing channel and campaign type. As outlined in our strategic framework for acquisition channel prioritisation 5 rules, reallocating budget toward channels that demonstrate rapid cash recovery improves overall capital efficiency. Directing media spend toward channels with fast payback cycles minimises revolving working capital requirements while maintaining new customer growth, which is ultimately what marketing spend efficiency looks like in practice rather than as an abstract ratio.
The early post-purchase period represents the most critical window for securing secondary transactions and closing initial acquisition debt. If a customer does not place a second order within 60 days of their initial purchase, the probability of securing a repeat order drops significantly, extending the payback timeline into high-risk territory. Operations teams must build automated post-purchase communication paths designed to drive rapid secondary orders.
Configure automated email and SMS workflows that deliver timely product usage guides, complementary accessory offers, and replenishment reminders shortly after delivery. To keep this outreach anchored in genuine satisfaction signals rather than guesswork, align your post-purchase monitoring with the international guidelines set out in ISO 10004:2018. Coordinate these workflows with parameters from our framework on predictive churn audit rules to identify accounts at risk of dropping off before reaching breakeven. Accelerating early repeat order frequency ensures that unrecovered acquisition costs are cleared quickly.
Setting uniform ad account bidding targets across a diverse product catalogue creates severe payback distortions. High-margin product categories can comfortably absorb higher bidding costs while maintaining short payback cycles, whereas lower-margin items generate extended payback timelines under the exact same bid limits. Media buyers must align bidding parameters with product-level gross margins and historical payback velocity.
Integrate inventory gross margin data directly with ad account bidding structures to set dynamic acquisition targets by product category. As detailed in our strategic guide on ecommerce dynamic pricing strategy, coordinating commercial margins with campaign bidding rules prevents overspending on low-margin inventory. Setting strict bidding limits aligned with product economics ensures every campaign satisfies your corporate payback targets.
Offering steep introductory discounts to attract cold ad traffic is an unoptimised acquisition tactic that damages initial contribution margins and extends payback timelines. Discounting initial orders reduces the upfront cash available to offset media costs, forcing the business to rely heavily on future repeat purchases to break even. Commercial teams must evaluate competitor promotional strategies to design compelling non-discount offers.
Continuously monitor rival acquisition offers, landing page structures, and bundle formats to identify value-add alternatives to price discounting. As outlined in our strategic guide on competitor ad audit 5 rules, analysing rival marketing strategies enables you to position unique product bundles and exclusive service perks. Offering value-add incentives rather than price cuts protects first-order gross margins, keeping payback timelines short.
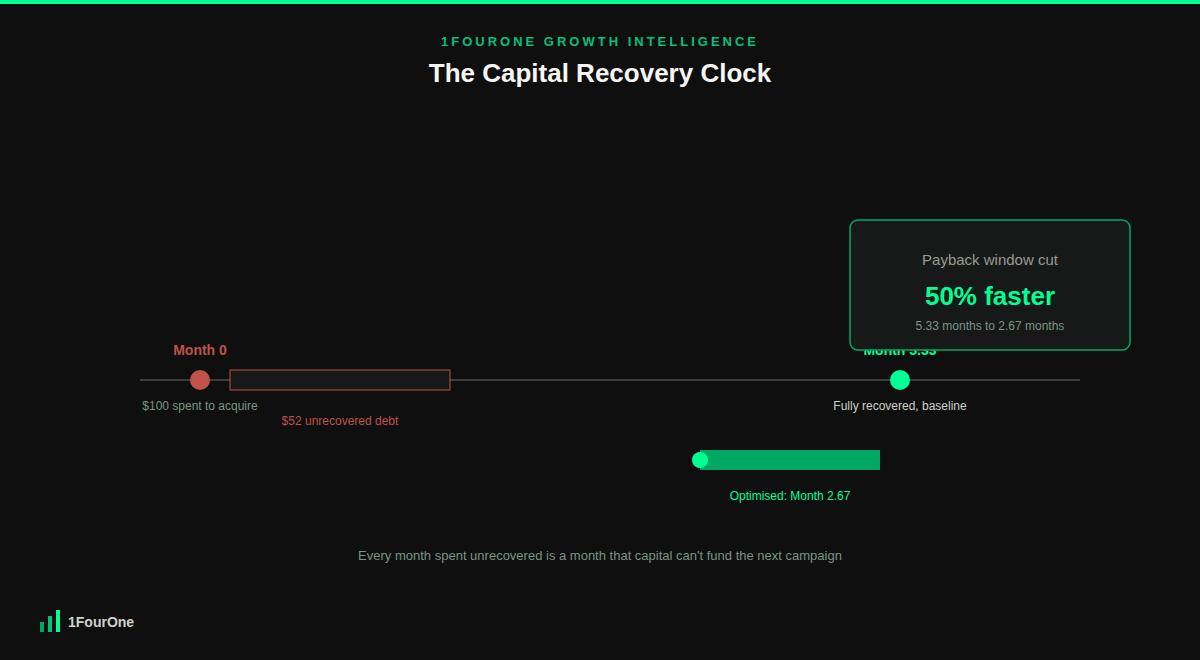
To evaluate the direct commercial impact of structured cac payback period optimisation, let us examine an established digital retailer spending $150,000 per month on paid customer acquisition to acquire 1,500 new buyers. Under the baseline operational state, blended Customer Acquisition Cost equals $100 ($150,000 media spend divided by 1,500 new buyers). Initial orders average $120 with a 40% gross margin, generating $48 in initial gross profit per customer. The remaining $52 of acquisition spend must be recovered through repeat purchases.
Reviewing historical repeat order data reveals a slow capital recovery cycle: customers make repeat purchases at a baseline velocity of 0.25 orders per month (one repeat order every 4 months yielding $48 in gross margin). Under this baseline setup, it takes 5.33 months of customer trading to fully recover the $100 acquisition spend ($48 initial profit + 1.08 repeat orders x $48 = $100). This extended payback timeline locks up $800,000 in revolving working capital across the 5-month recovery cycle, straining corporate liquidity.
The brand’s growth operations team implements a comprehensive cac payback period optimisation framework to compress this recovery cycle. They deploy automated post-purchase bundle upsells at checkout, elevating initial Average Order Value from $120 to $150 ($60 initial gross profit at a 40% margin). Simultaneously, they reallocate $30,000 away from slow-payback channels into high-intent search networks, dropping monthly ad spend to $120,000 while maintaining the 1,500 new buyer volume ($80 blended acquisition cost).
This operational alignment transforms the capital recovery metrics completely. Initial gross profit per customer increases to $60 toward the reduced $80 acquisition cost, leaving only $20 of unrecovered media spend after the first order. At the baseline repeat gross margin velocity ($12 per month per customer), clearing this remaining $20 balance takes 1.67 further months of repeat trading, on top of the initial month in which the first order already landed — a true total payback window of 2.67 months. The capital recovery window contracts from 5.33 months down to 2.67 months, a 50.0% reduction in capital lockup duration, measured on a consistent basis against the same true baseline methodology.
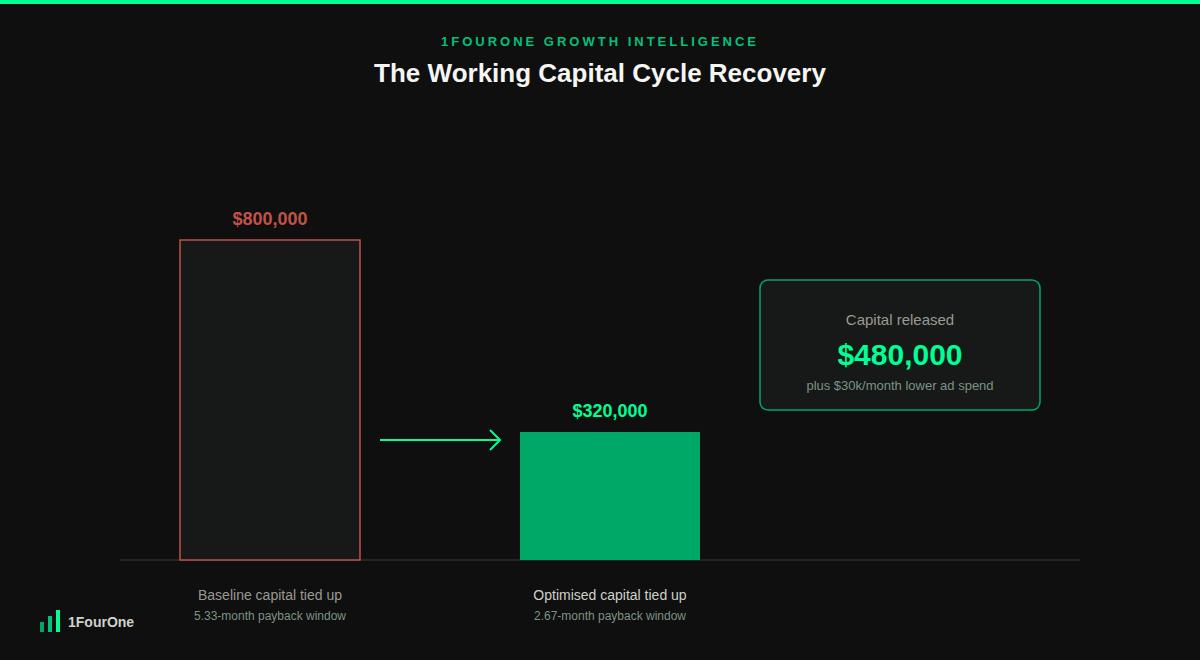
The financial return from this payback acceleration program is immediate and highly transformational for corporate liquidity. Revolving working capital tied up in acquisition debt drops from $800,000 down to $320,000 (2.67 months multiplied by the new $120,000 monthly spend), releasing $480,000 in liquid capital back to the corporate balance sheet. Concurrently, monthly acquisition spend decreases by $30,000 ($360,000 annualised savings) on identical customer volume, creating a self-funding acquisition engine that supports sustainable business growth.
The CAC payback period measures the exact time in months required for a customer cohort to generate sufficient gross contribution profit to fully recover upfront acquisition media costs. The Lifetime Value to CAC ratio compares total cumulative net profit generated by a customer over their entire multi-year relationship against initial acquisition spend. While LTV:CAC measures long-term return on investment, payback period measures short-term capital velocity and liquidity risk.
For mid-market digital retail brands, a healthy CAC payback period typically ranges between 3 and 6 months on a gross contribution margin basis. Payback periods under 3 months represent exceptional capital efficiency, allowing rapid reinvestment of marketing cash flow. This is the practical target most cac payback period optimisation programmes work toward, since payback periods extending beyond 12 months introduce significant financial risk and require large working capital reserves to sustain acquisition spend.
Increasing initial average order value directly expands the upfront gross contribution dollars available to offset initial acquisition spend. If the additional order value carries healthy gross margins, a larger percentage of the upfront acquisition cost is recovered on the day of the initial transaction. This upfront profit capture reduces the remaining acquisition debt, shortening the time required for repeat purchases to achieve breakeven.
Brand search campaigns should be evaluated in separate reporting silos when calculating acquisition payback metrics. Brand search traffic captures existing high-intent buyers who already possess brand awareness, delivering artificially low acquisition costs and rapid payback metrics. Blending brand search with cold traffic channels obscures the true payback timeline of cold customer acquisition campaigns, leading to distorted media allocation decisions.
Track payback timelines by segmenting customer cohorts according to their initial entry product category rather than a single storewide average. High-frequency consumable product lines will naturally exhibit faster repeat order velocity and shorter payback timelines than low-frequency durable goods. Category-specific payback benchmarks ensure media bidding limits accurately reflect the capital recovery velocity of each product line.
Allowing extended payback timelines to tie up working capital is an expensive operational oversight that restricts retail growth. At 1FourOne, we eliminate liquidity bottlenecks by deploying structured payback optimisation frameworks that accelerate cash recovery and protect operating margins. Contact our growth operations team today to secure a data-driven capital efficiency audit tailored for your business.
Get your competitive audit in 48 hours and see exactly where your revenue is leaking.
Get Your Audit →