Customer Journey Mapping: Plugging E-Commerce Revenue Leaks
You are successfully driving high-intent traffic to your e-commerce platform. Your paid search campaigns are tightly targeted, your organic visibility is strong for the category, and your digital PR is securing credible citations. Yet your top-line revenue is not scaling in line with what you spend to acquire that traffic. This is the structural reality for many mid-market retail directors: you do not have an acquisition problem, you have a revenue leakage problem.
Every percentage point of conversion drop-off is capital handed directly to a competitor. When high-intent buyers reach your site and fail to purchase, the product itself is rarely the issue. More often, the sequence of interactions they experience along the way is what breaks down, and customer journey mapping is the diagnostic process built to find exactly where.
A structured customer experience audit traces the buyer’s entire path, from first impression through to post-purchase loyalty, and measures the friction at every transition point. If your technical architecture and user experience are not aligned with what the buyer expects at each stage, your traffic spend is effectively funding your competitors’ market share. This article walks through exactly where those leaks form and how to close them.
Marketing teams often assume that capturing the click is the hardest part of the acquisition process, and that the website will handle the rest on its own. This creates a disconnect between the promise made by an advertisement and the reality delivered by the landing page. When a buyer clicks a highly specific ad for, say, a matte black espresso machine with dual boilers, they expect to land on a page that instantly confirms they found the right product.
If they land on a generic category page instead, or a product page that takes four seconds to load its images, the cognitive load becomes too high and the session ends. This is exactly what customer journey mapping is built to expose: not a vague sense that conversion is low, but the specific point in the e-commerce conversion funnel where the mismatch occurs.
Standard analytics often hide the true cause of these failures. A 65% bounce rate on a product page might look like a targeting problem, when the real issue is that a JavaScript pricing module fails to load on mobile. Traffic rarely fails to convert by accident. It fails because a specific, identifiable barrier sat in its way, and that barrier is what the mapping process is designed to find.
In an e-commerce growth intelligence context, customer journey mapping is not a flowchart sketched on a whiteboard. It is a structured process of tracking a buyer’s progression from initial brand unawareness through to post-purchase loyalty, quantifying the drop-off at every transition point.
A standard audit tells you that users are leaving. This process tells you why they are leaving, where they go instead, and what needs to change to keep them moving forward. It works by overlaying quantitative analytics, such as session duration and exit rates, with qualitative behavioural data like heatmaps and session recordings.
Applying this discipline consistently shifts a retailer’s focus from raw traffic acquisition to revenue retention. The question stops being how do we get more people to the site, and starts being how do we remove the friction stopping the visitors we already have from buying. That shift in framing is the defining trait of a mature, data-driven retail operation.
To justify the investment, you need to quantify the cost of inaction. Revenue leaks compound quickly. Consider a mid-market retailer generating $10 million in annual digital revenue at an average conversion rate of 1.8%.
If a fragmented checkout process is suppressing that rate, raising it by just 0.4 percentage points, to 2.2%, yields an additional $2.2 million in revenue without spending a single extra dollar on advertising. Locating that 0.4% is precisely what customer journey mapping is for.
| Friction point | Symptom | What to fix |
|---|---|---|
| Ad-to-site disconnect | High bounce rate on entry | Align ad copy with the landing page H1 and hero image |
| PDP information deficit | High time-on-page, no add-to-carts | Structure technical specs for fast, scannable reading |
| Validation exit | Exit to search for reviews | Embed verified third-party reviews near the buy button |
| Checkout complexity | High cart abandonment | Add express payment options (Apple Pay, Shop Pay) |
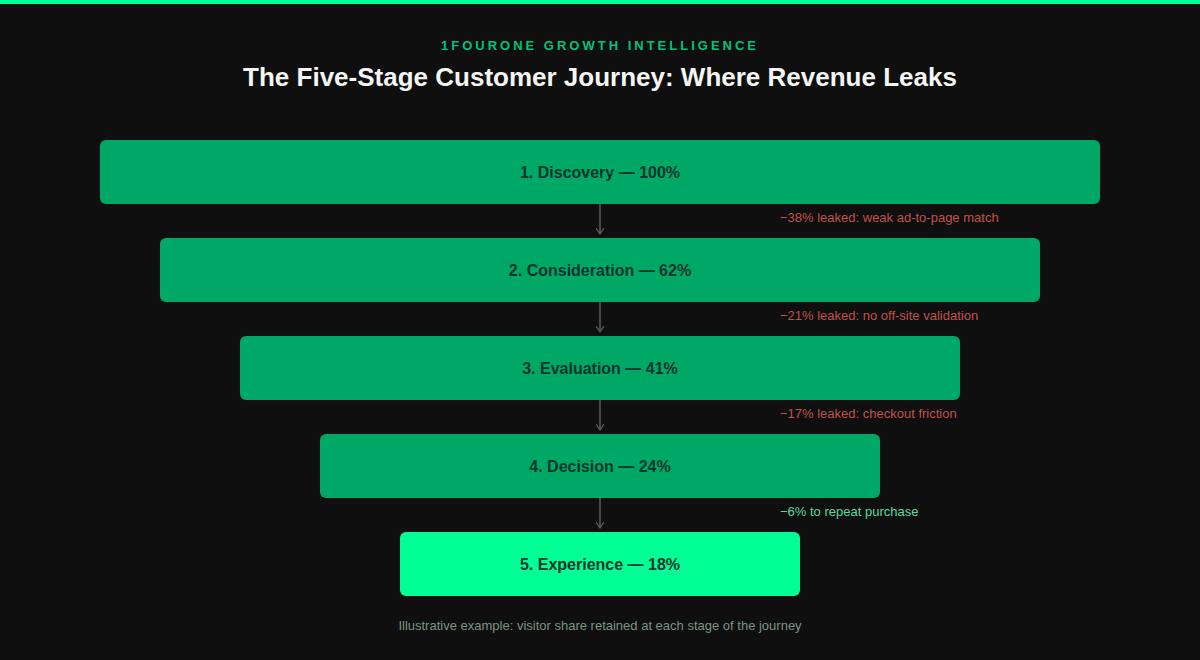
A customer experience audit breaks the path to purchase into five distinct, measurable stages. Customer journey mapping applies that same discipline to each one, so every stage gets its own technical and content fixes rather than a single generic recommendation.
The journey begins before a user ever reaches your domain. During discovery, you need to evaluate how your brand appears in search engines, social feeds, and affiliate networks. The objective is not impressions, it is qualified intent.
If your SEO strategy targets broad, high-volume keywords rather than specific transactional queries, you fill the top of the funnel with people who have no immediate intention to buy. Tracking the performance of these different acquisition cohorts makes the difference obvious: someone searching “best running shoes 2026” behaves nothing like someone searching “buy Nike Pegasus 40 black size 10”.
Mapping this stage lets you cut budget from vanity metrics and reallocate it toward channels that deliver pre-qualified buyers. The query a user typed needs to match the page they land on, or you create friction before they have even seen the product.
Once a user reaches a product detail page, they enter the consideration stage, the most contested point in the entire conversion funnel. This stage most often reveals that brands bury the exact facts a buyer needs under marketing copy.
A frictionless PDP answers a buyer’s objections instantly: what are the dimensions, is it in stock, when will it arrive, what is the return policy. If someone has to scroll past three paragraphs of brand narrative to find the shipping cost, the data will show a spike in exits at that exact point on the page.
Technical performance matters just as much here. A high-resolution image gallery that causes layout shift, or delays the page becoming interactive, creates a subconscious frustration that shows up directly in Core Web Vitals data. Google’s own research with Deloitte found that a 0.1-second improvement in load time lifted retail conversions by 8.4%, which is the kind of margin a slow PDP quietly gives away every day.
Modern buyers rarely purchase without seeking validation elsewhere. They open a new tab, search your brand name alongside the word reviews, or look for a Reddit thread on the product’s durability. This is the evaluation stage, and it is a significant blind spot for any brand that has not mapped it.
Increasingly, that off-site search happens inside an LLM rather than a search engine. A buyer asking ChatGPT or Perplexity to compare your product against a rival is running the same evaluation step, just on a different platform, which is exactly the territory an AI brand visibility audit is built to cover.
When a user leaves your site to evaluate you elsewhere, you lose control of the narrative, and an affiliate article can redirect them to a competitor just as easily as it can validate you. The fix is to bring that validation on-site: pull live Trustpilot scores, embed user-generated content from Instagram, and display verified buyer badges next to your reviews.
The decision stage covers the cart and the checkout. This is where friction is most expensive, because a user who has added an item to their cart has already stated an intent to buy. Losing them here is a measurable failure of the actual interface, not a vague targeting problem.
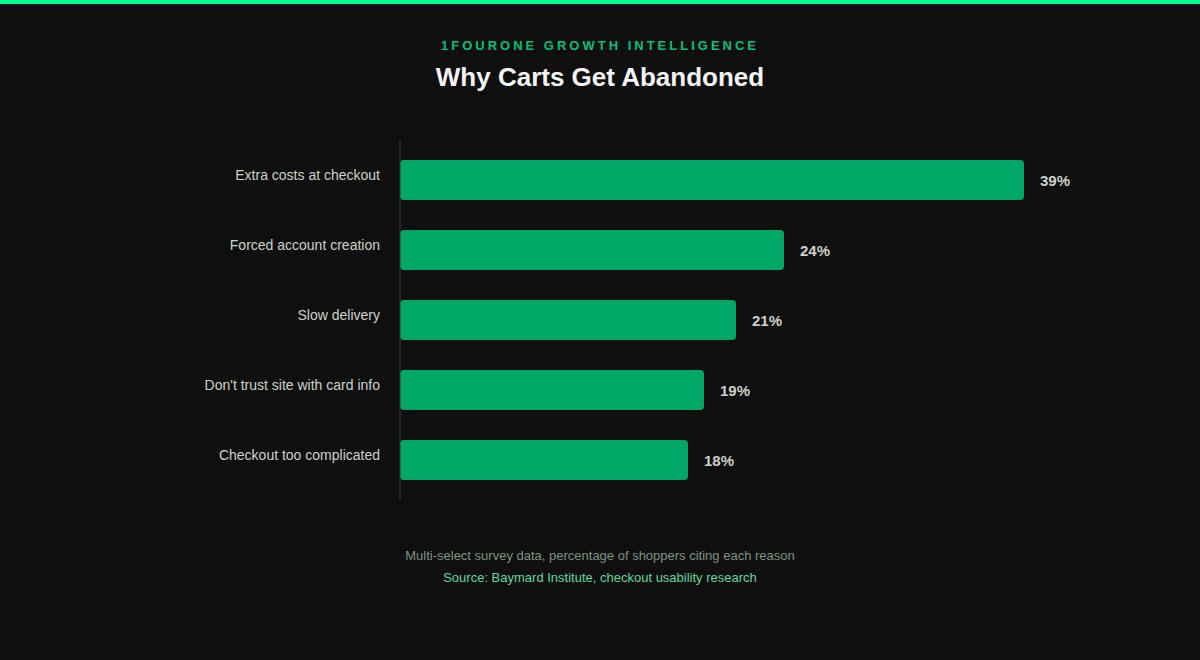
Mandatory account creation is one of the most reliable conversion killers in e-commerce. The Baymard Institute’s meta-analysis of 50 separate studies puts the average cart abandonment rate at 70.22%, with forced account creation among the leading causes. Guest checkout has to be the default, prominent path, not an afterthought buried below a sign-in form.
Payment friction matters just as much. Typing a 16-digit card number on a phone while commuting is a high-friction task, which is why express options like Apple Pay, Google Pay, and Shop Pay are the backbone of a frictionless checkout. When someone can confirm a $200 purchase with a single biometric scan, the time to purchase drops from minutes to seconds, and the revenue that checkout fatigue would otherwise have cost you stays in the funnel.
The transaction is not the end of the journey, it is the start of the retention cycle. Order tracking, delivery notifications, and the unboxing experience all feed directly into customer lifetime value, and mapping this stage means treating it with the same rigour as the stages before checkout.
If a customer spends a meaningful amount and hears nothing from you for five days until a courier text arrives, anxiety builds, and that anxiety is exactly what stops them buying from you a second time. You end up paying to re-acquire a customer you already had.
Proactive SMS updates, a branded tracking portal, and a self-service returns process all close this gap. A customer who experiences a genuinely frictionless return is one of the more reliable predictors of repeat purchase, and is also the same kind of direct brand authority signal that shows up in a competitive market share analysis further down the line.
Running customer journey mapping at scale requires more than one type of data. Quantitative numbers give you the skeleton of the map, qualitative behaviour gives it intent and motive.
Combine all three and customer journey mapping stops being guesswork and becomes a precise, evidence-based tool for commercial growth. You are no longer debating button colours in a meeting, you are making changes the data has already mandated.
It is worth separating this from basic conversion rate optimisation. Traditional CRO often narrows down to isolated A/B tests, changing a button from blue to green, or trialling two different hero headlines. Those micro-optimisations have value, but they do not fix structural revenue leaks.
Customer journey mapping is the strategic framework that tells you where CRO should even be applied. A growth intelligence approach looks at the whole ecosystem rather than one isolated screen, because there is no point aggressively testing a checkout button if the real problem is that shipping costs only appear at the very last step and cause immediate price shock.
A genuine growth intelligence approach aligns paid media, SEO, UX design, and customer service around a single objective: removing every barrier between a buyer’s initial intent and the completed transaction.
Moving from a traffic-focused strategy to a revenue-retention model takes dedicated data engineering. You cannot plug revenue leaks until you know exactly where they are happening and how much capital is escaping through them. An internal review will not give you the objective distance this requires.
1FourOne runs structured customer journey mapping for established retail brands to find and close that commercial friction. We audit your entire cross-channel path to purchase, isolate the specific points of failure, and build data-driven UX and technical playbooks to recover the revenue you are currently losing. Contact our Growth Intelligence team to baseline your funnel and start building a genuinely frictionless path to purchase.
Get your competitive audit in 48 hours and see exactly where your revenue is leaking.
Get Your Audit →