Competitive Market Share Analysis: Finding The Revenue Gap
Most retail marketing directors operate with a restricted view of their commercial environment. They rely on internal analytics platforms to measure success, tracking every visit, bounce, and conversion that happens inside their own domain. This internal focus reveals exactly how existing visitors behave once they arrive. It fails completely to show where the rest of the market is spending its money.
Running a competitive market share analysis changes this dynamic entirely. It shifts the perspective from internal conversion metrics to external revenue capture, mapping your total addressable audience against the brands actually winning it. By isolating precise structural deficits across organic, paid, referral, and direct channels, merchants can see exactly where competitors are taking ground that should be theirs. This intelligence forms the foundation of a targeted commercial response.
This is not a one-time competitive snapshot. A properly run market share audit becomes a recurring discipline, repeated quarterly as channels shift and new competitors enter the category. Without it, marketing budgets get allocated based on internal assumptions rather than the actual shape of demand in the market.
Standard analytics suites provide a comforting illusion of control. They track every click, bounce, and conversion that occurs within your own digital walls, and that data is essential for conversion rate optimisation. It is, however, almost useless for actual market positioning. You cannot measure your true category dominance by only looking at your own customers.
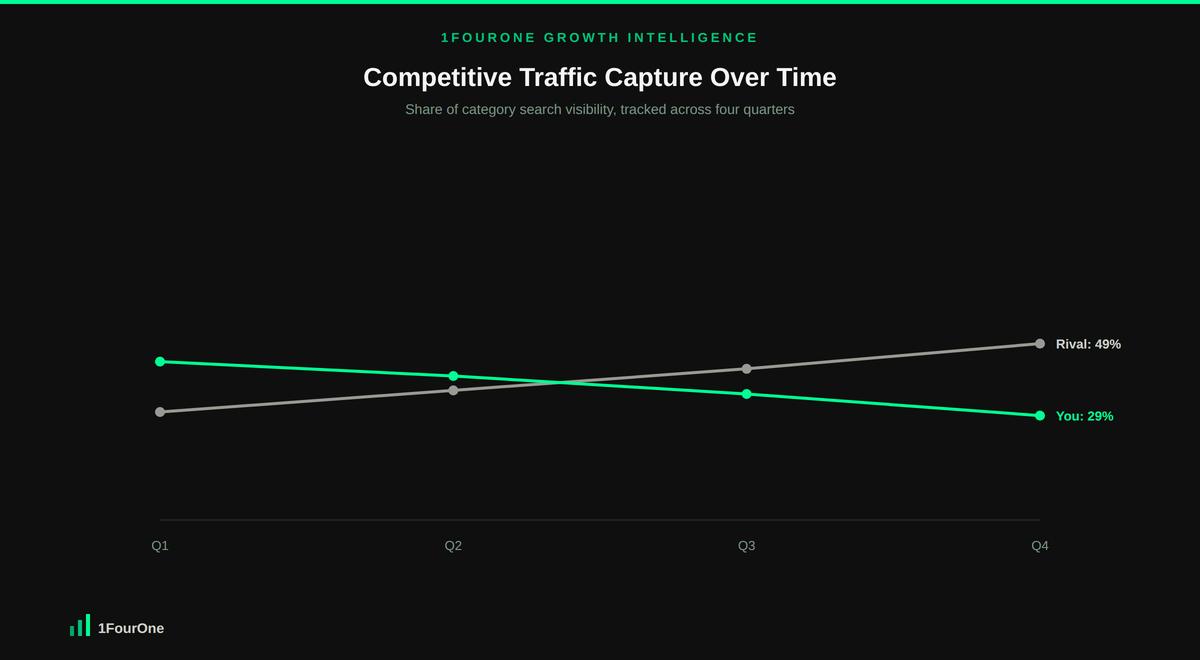
Your internal data represents a fraction of the total commercial intent in your sector. If your organic traffic grows by 10% while the overall market expands by 40%, you are actually losing ground, even though every internal report shows positive growth. Relying solely on Google Analytics creates a strategic blind spot that hides the specific channels where competitors are actively capturing your prospective buyers.
External signals close this gap. Research from the IPA’s share of search think tank found that a brand’s online search share correlates with its actual market share at an average of 83% across categories and countries. That single external metric offers a usable proxy for competitive standing well before a single transaction occurs. The same blind spot applies to AI search visibility, where your own analytics show nothing about how often a competitor gets cited by an LLM instead of you.
A competitor deficit is the measurable gap between your current audience capture and the total available market traffic. It occurs when rival brands dominate specific acquisition channels that you have underfunded or ignored. A cross-channel competitor analysis identifies these gaps by extracting data from across the entire digital ecosystem rather than from a single channel report.
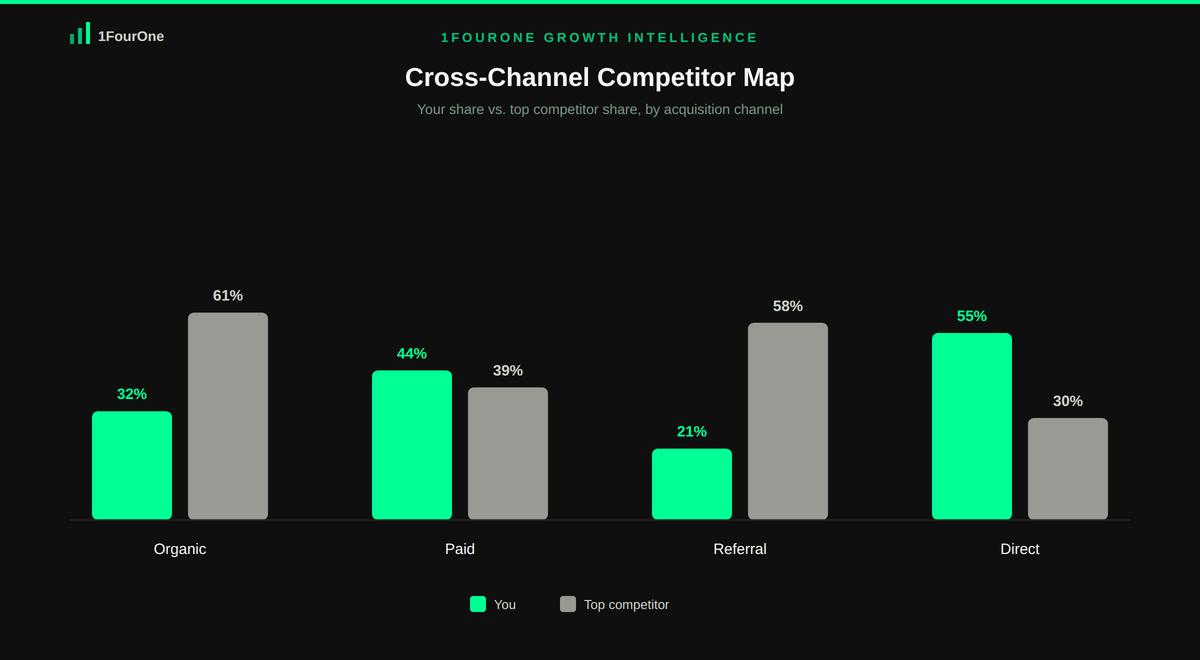
This deficit rarely exists evenly across all marketing channels. A retail brand might maintain absolute dominance in paid search while remaining completely invisible in organic product queries, or it might win on direct brand recall while losing the referral channel entirely to a single dominant affiliate publisher. A proper cross-channel competitor analysis isolates these exact discrepancies rather than averaging them into a single, less useful score. It provides a mathematical baseline showing precisely where revenue is leaking to competing brands.
A cross-channel competitor analysis is only as good as the data feeding it. Quantifying a deficit requires sources that sit outside your own analytics stack. Tools such as SimilarWeb estimate competitor traffic volume by channel, while the Meta Ad Library and Google Ads Transparency Center reveal exactly which creative and offers rivals are running right now. BuiltWith and similar tools confirm the technology stack a competitor relies on, which often signals how sophisticated their broader marketing operation actually is.
None of these tools alone produces a usable answer. The value comes from layering organic visibility, paid spend signals, referral sources, and direct traffic estimates into a single comparative view across your three or four closest category rivals. Treat the first pass as a baseline, then repeat the exercise quarterly to see whether the gap is closing or widening.
Interpreting the output matters as much as gathering it. A competitor with a sudden spike in paid aggressiveness might simply be testing a new market rather than mounting a sustained challenge. Look for signals that persist across at least two consecutive quarters before reallocating significant budget in response.
To build an accurate map of your market position, you must analyse four distinct acquisition vectors. Each pillar isolates a different way a competitor can be taking revenue that should belong to you.
High-intent search visibility dictates long-term acquisition costs more than any other channel. We measure which brands command the top positions for the most valuable commercial queries in a category, not just branded search terms. If competitors own the educational and product comparison searches, they control the buyer’s narrative before that buyer ever reaches your site. A brand that ranks for the comparison and “best for” queries in its category is capturing demand at the exact moment a purchase decision is forming.
Increasingly, this organic battle extends beyond traditional search results. The same competitive dynamic now plays out inside ChatGPT and Perplexity, where an AI brand visibility audit measures whether your brand or a rival gets cited when a buyer asks for a recommendation.
Search engine marketing is a zero-sum environment where every impression a competitor wins is one your brand did not get. Tracking rival bidding strategies reveals how aggressively they are attempting to acquire market share, and at what implied cost. We analyse whether competitors are bidding on your exact brand terms to siphon direct loyalty traffic, which is one of the clearest signs of an aggressive challenger brand. A sudden increase in a rival’s paid presence around your own product launches or seasonal peaks is rarely a coincidence.
This is not a fringe tactic. A 2026 analysis of 8.5 million Google Search ads across 25 major brand keyword auctions found that one in eight ads shown on a brand’s own name came from a different advertiser entirely.
Third-party validation drives significant revenue for modern e-commerce, often more than brands realise until they see a competitor’s referral network mapped out. We map the digital PR placements and affiliate networks funnelling high-converting traffic to category leaders. Securing placements on these exact same publisher domains, rather than running a broader and less targeted PR campaign, is what actually closes the referral gap. Forrester’s 2026 affiliate marketing forecast puts global affiliate spend at $19.4 billion worldwide, making it the third-largest performance marketing channel behind paid search and paid social.
Direct traffic is the ultimate indicator of unprompted brand recall, the audience segment that bypasses search engines entirely to navigate straight to a preferred retailer. Measuring this volume against rivals shows the true strength of your market positioning, independent of any single channel’s algorithm changes. A brand with strong direct traffic has pricing power and resilience that purely paid-acquisition competitors do not.
Consider a mid-market homeware retailer with healthy year-on-year growth in its own analytics dashboard. A cross-channel competitor analysis might reveal that two rivals are capturing 70% of organic visibility for the retailer’s three highest-value product categories, while a single affiliate publisher is sending more referral revenue to a competitor than the retailer generates from referrals entirely.
None of this would be visible from inside Google Analytics. The retailer’s own metrics would show growth quarter over quarter right up until that organic and referral erosion flattens the trend, by which point the competitor has already established the citations, reviews, and rankings that are expensive and slow to displace.
The fix in this scenario is not a blanket increase in marketing spend. It is a targeted reallocation: contesting the specific comparison queries the two organic competitors currently own, and approaching the dominant affiliate publisher directly to secure better placement terms. Both actions are precise responses to a measured deficit, not a guess.
Raw traffic volume is a misleading metric for e-commerce success. Generating 1 million monthly impressions means nothing if those users have no commercial intent, and a vanity metric that looks impressive in a board deck can mask a shrinking share of the categories that actually drive revenue. Growth intelligence focuses entirely on the acquisition of high-value, ready-to-buy audiences, not on raw scale.
The objective is not to beat competitors on every conceivable metric. The goal is to identify the specific, high-converting channels where they currently hold an unfair advantage, and to redirect marketing capital toward those exact structural weaknesses. Once you isolate these vulnerabilities, every pound of incremental budget works harder than it did under a generic, channel-agnostic growth plan.
A pre-revenue startup has no market share to defend and limited budget to run a full cross-channel competitor analysis in the first place. An established retail brand with years of trading history is in a different position entirely. It has existing customers, existing rankings, and existing market share that can erode quietly while quarterly revenue still looks acceptable on paper.
This is precisely the blind spot that catches experienced marketing directors off guard. Growth that feels steady from inside the business can mask a competitor capturing a larger share of a category that is itself growing even faster. The brands most at risk are not failing, they are simply growing more slowly than the market around them, which is a far harder problem to notice without external data.
No. Your own analytics platform remains essential for understanding on-site behaviour, conversion paths, and the performance of campaigns you control directly. This kind of external analysis sits alongside that data, adding the context of what is happening across the rest of the category. You need both views to make an informed budget decision.
Quarterly is the practical minimum for most established retail brands. Paid bidding strategies and affiliate placements can shift within weeks, but the bigger structural patterns, such as organic dominance or direct brand authority, move more slowly and are best tracked over two to three quarters to separate genuine trend from short-term noise.
Three to five direct category rivals is usually enough to be useful without becoming unmanageable. Including too many competitors dilutes the analysis into a generic industry overview rather than a sharp, actionable picture of where you are specifically losing ground. Pick the brands your own sales team names most often when they lose a deal.
Yes, if a meaningful share of your category’s purchases happen on marketplaces. A brand can win every metric in this analysis on its own website and still lose the category if buyers are comparing options on Amazon or a similar marketplace before they ever reach a branded domain. Treat marketplace share of search and reviews as a fifth data point alongside the four core pillars.
Yes, though the manual version is time-consuming. The publicly available tools mentioned above, including SimilarWeb, the Meta Ad Library, and Google Ads Transparency Center, can produce a rough picture without a paid platform. Cross-referencing them by hand across several competitors and four channels takes meaningful time each quarter, which is exactly the gap a structured growth intelligence engagement is built to close.
Share of search is one useful proxy within the organic pillar, estimating relative brand interest from search volume alone. A full analysis goes further, layering paid aggressiveness, referral dominance, and direct brand authority on top of that organic signal to produce a complete, four-channel picture rather than a single metric.
Guessing your market position based on internal reporting is a high-risk commercial strategy. You need definitive data to understand exactly how your brand stacks up against the category leaders across all four channels, not just the one your team happens to track most closely. 1FourOne engineers precise intelligence reports to reveal your true competitive standing, built on the same external data sources covered above rather than guesswork or a single platform’s dashboard.
Our growth intelligence team runs the same cross-channel competitor analysis covered above against your primary rivals, then turns the results into a data-driven playbook to reclaim lost market share. Contact our Growth Intelligence team to establish your baseline metrics and begin capturing the revenue your current strategy is missing.
Get your competitive audit in 48 hours and see exactly where your revenue is leaking.
Get Your Audit →