Why Your Internal Metrics Are Lying to You About Growth

Deploying a structured competitive benchmarking framework is the baseline requirement for mid-market e-commerce operators seeking to defend their net contribution margins from escalating advertising auction inflation. As digital landscapes grow increasingly volatile and ad platforms restrict data tracking protocols, relying on an insular view of internal metrics introduces unacceptable structural vulnerabilities into a retail balance sheet. Brands that blindly direct capital into channels without validating external baseline standards frequently subsidise unprofitable customer cohorts at the expense of sustainable growth. Transitioning to an objective, multi-brand evaluation model allows retail executives to identify immediate capital leaks, stabilise their customer acquisition costs, and allocate media spend based on clear performance comparisons.
Mid-market retail enterprises frequently rely on their internal analytics tools to gauge commercial success. When monthly gross transactions increase by 5%, management teams treat the change as proof of an optimised operational roadmap. However, if the broader industry segment expanded by 20% over the exact same period, that internal growth actually masks a significant loss of industry standing. Assessing performance parameters without mapping them against external data blocks prevents your team from recognising when your competitors are capturing market demand at a faster rate.
Evaluating commercial performance without clear industry baselines skews your strategic infrastructure. Internal tracking panels highlight what your active audience is doing, but they cannot show why non-converting segments choose a competitor instead. When growth strategies are built entirely on isolated data, businesses end up pouring more capital into unoptimised campaigns that fail to drive real incrementality. This standard analytical oversight dilutes your media efficiency and limits your capability to protect long-term margins.
To establish a stable corporate baseline, retail operators must link their internal KPIs directly to external market measurements. To accurately contextualise these figures, teams should consult foundational strategies like a formal competitive market share analysis to trace broad revenue gaps. Understanding how your digital presence stacks up against the surrounding industry exposes structural vulnerabilities before they degrade your cash reserves. Shifting to an outbound analytical approach ensures your team can protect its core customer accounts and deploy media capital only where your brand holds a clear transactional advantage.
A sophisticated strategy requires deeper operational insights than simple top-line traffic summaries can provide. True growth intelligence relies on a deep understanding of multi-channel consumer pathways, cross-platform audience overlap, and historical customer lifetime value. By analysing these complex interaction layers, growth teams can determine which traffic channels provide stable margins and which ones merely generate hollow conversion volumes. This systematic oversight prevents brands from pursuing vanity metrics that damage real cash flow.
Evaluating every competitor acquisition channel within your immediate market segment exposes unserved audience demand. Mapping where competing brands invest their main marketing funds highlights high-cost auction environments that your media buyers should avoid. If the top three market participants concentrate their resources on a single traffic source, a profitable opening emerges to scale your presence through targeted organic search or strategic content distribution networks. This focused benchmarking allows you to capture high-intent audience segments.
This isolation problem compounds when it reaches paid customer acquisition specifically. A brand that only tracks its own cost per acquisition has no way of knowing whether a rising number reflects genuine market-wide inflation or a single competitor acquisition channel becoming newly saturated by an aggressive rival. A competitive benchmarking framework closes this gap by holding internal acquisition costs against category-wide signals, not against last quarter’s internal average alone.
Achieving total operational clarity requires growth teams to continuously track these external indicators alongside standard internal conversion data. A traffic channel that appears highly optimised on your internal dashboard may actually be losing ground to an aggressive rival platform play. Documenting these macro market dynamics across your category allows you to build a highly agile media architecture that actively supports your long-term retail viability.
| Analysis Vector | Key Performance Indicator | Operational Value |
|---|---|---|
| Search Visibility Index | Share of non-branded generic search queries | Exposes foundational gaps in long-term organic customer acquisition. |
| Paid Impression Share | Auction concurrency and top-of-page frequency | Measures immediate competitor paid customer acquisition pressure. |
| Traffic Density Ratio | Total monthly unique sessions relative to sector | Establishes the true baseline for relative brand market scale. |
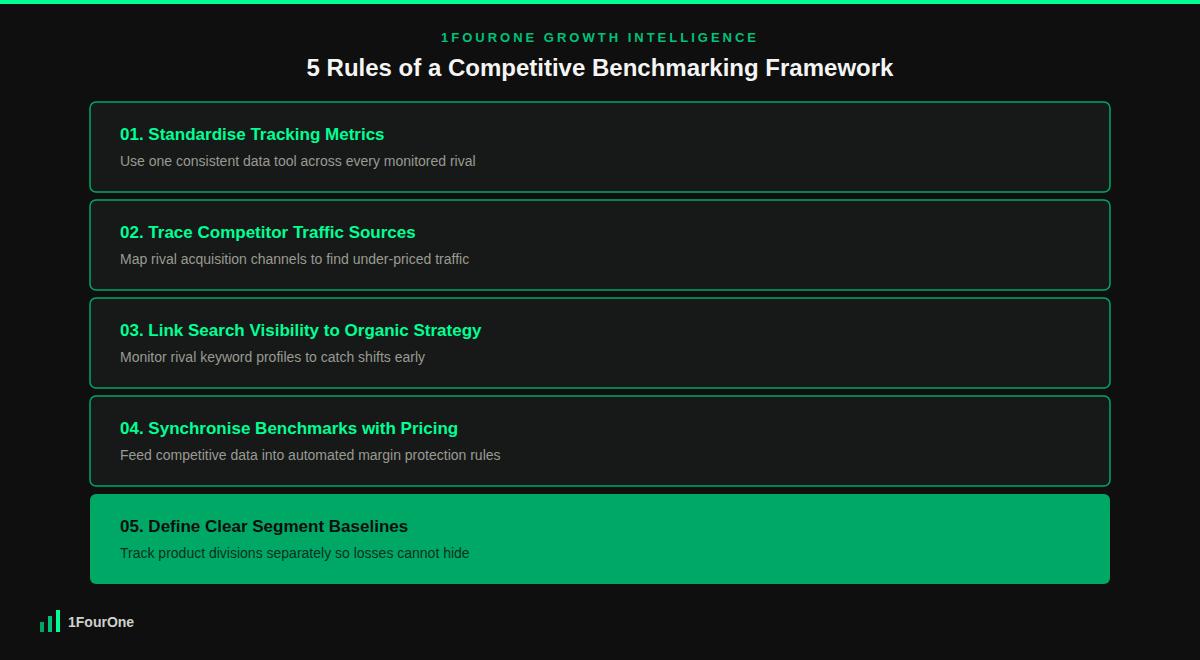
To systematically maximise your digital market presence, your operations team must apply this framework with discipline. This protocol moves your strategic planning away from subjective assessments and anchors it in structured, data-driven rules. The following five rules provide a repeatable method to track competitor scale, minimise media waste, and protect your commercial retail margins.
The primary hurdle when executing an industry review is compiling disjointed data into a clean, uniform dataset. Different tracking tools use varied sampling methodologies, which often introduces reporting bias into your competitive benchmarks. To eliminate this issue, you must establish an explicit baseline model that relies on a consistent set of data tools across all monitored entities. If you track your brand’s traffic via specialised domain indexes, you must use that identical index to evaluate your rivals.
This is precisely the problem industry measurement bodies exist to solve. The Media Rating Council has spent over sixty years auditing and accrediting measurement methodologies specifically because inconsistent tracking standards between providers make cross-platform comparisons unreliable without a shared baseline. Using standardised tracking models prevents your growth teams from making major resource investments based on skewed data parameters. This operational discipline ensures that every competitive insight translates into an accurate view of true industry scale.
Operating a media mix without analysing rival acquisition architectures leaves your business exposed to unexpected auction inflation. Your team must map the traffic distributions of your top five immediate competitors to isolate their primary volume drivers. Documenting their reliance on paid search, organic loops, or referral paths highlights the exact customer acquisition models that convert best in your category. You can then adjust your internal marketing spend efficiency targets to exploit the gaps they leave behind.
This deep platform review must be paired with automated ad tracking systems. As outlined in our strategic guide on competitor ad audits, observing the velocity and longevity of rival ad creative uncovers their high-performing offer structures. Use these data points to optimise your own paid media distribution, ensuring you divert capital from saturated networks into high-margin acquisition environments.
Organic search performance is a primary indicator of long-term brand health and customer trust. A competitor that steadily captures non-branded generic search terms is building a low-cost customer acquisition engine that will eventually squeeze your paid campaigns. Your internal media pipeline must continuously monitor the organic keyword profiles of your primary market rivals to catch these structural shifts early.
If an industry competitor captures high-intent category terms, their baseline marketing spend efficiency improves dramatically, allowing them to reinvest those savings into aggressive pricing actions. To counter this threat, your content teams must design targeted content sequences that close these specific keyword gaps. This programmatic approach protects your visibility in search results and ensures you maintain a steady flow of high-intent organic traffic.
Rival retail operators constantly adjust their commercial parameters to attract price-sensitive digital shoppers. A major operational failure is evaluating your market position without connecting those insights to your product pricing architecture. A properly integrated competitive benchmarking framework ties these observations directly into your automated inventory pricing systems to protect core product margins.
When competitive analysis indicates a rival is liquidating specific inventory lines, your systems should automatically hold your margin floors rather than entering an unprofitable price war. This integration is covered extensively in our operational guide on ecommerce dynamic pricing, which highlights the need for real-time coordination between market tracking and margin protection rules. Aligning these systems protects your marketing spend efficiency as much as it protects unit economics, since no acquisition channel is efficient if the margin it feeds is being quietly eroded elsewhere.
Relying on broad, global industry reports can easily obscure dangerous capital leaks within specific product divisions. To maintain absolute control over your financial performance, your growth operations team must set up distinct segment baselines for individual product categories. This granular tracking separates high-performing collections from underperforming lines, providing a highly realistic view of your true operational position.
The stakes of getting this wrong are well documented. Research popularised by Bain & Company’s Frederick Reichheld, cited in the Harvard Business Review, found that a 5% improvement in customer retention can increase profits by 25% to 95% — the inverse is just as true when a segment’s retention quietly erodes unnoticed. Establishing clear segment baselines keeps your growth team focused on protecting operating margins, ensuring that capital expansions are directed only into highly profitable product divisions.
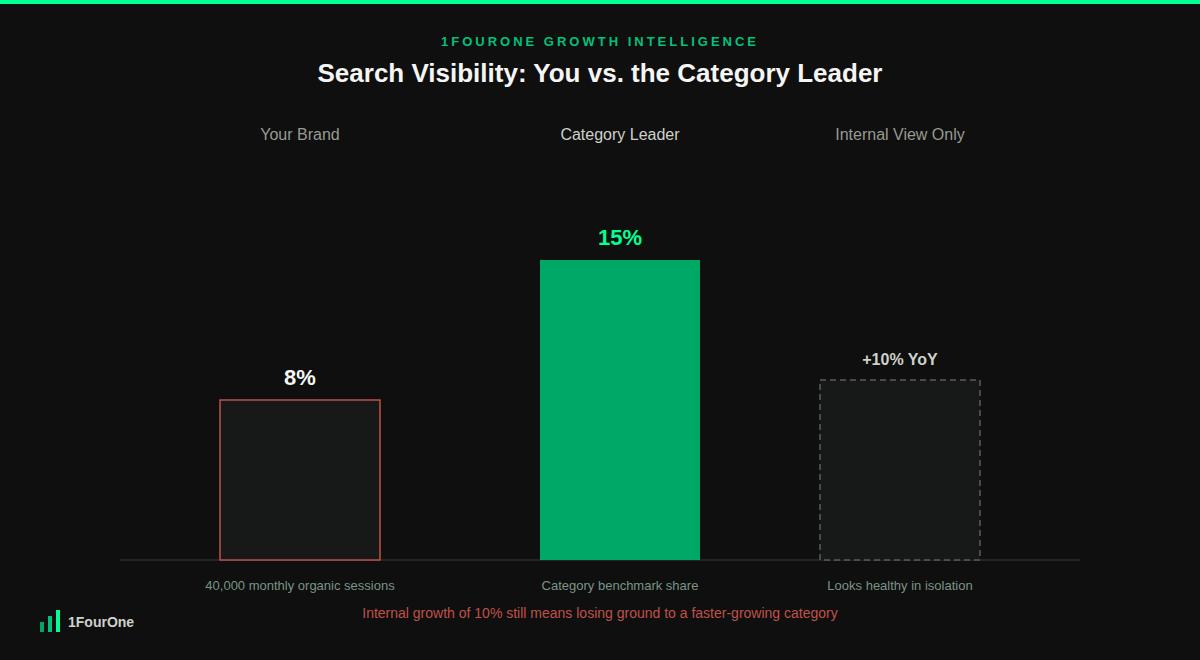
To evaluate the commercial impact of a competitive benchmarking framework, consider a mid-market home goods brand operating in a category with a total non-branded search volume of 500,000 monthly queries. Internally, the brand’s organic traffic looks healthy: sessions from non-branded search are up 10% year-on-year, and the growth team has no reason to suspect a problem.
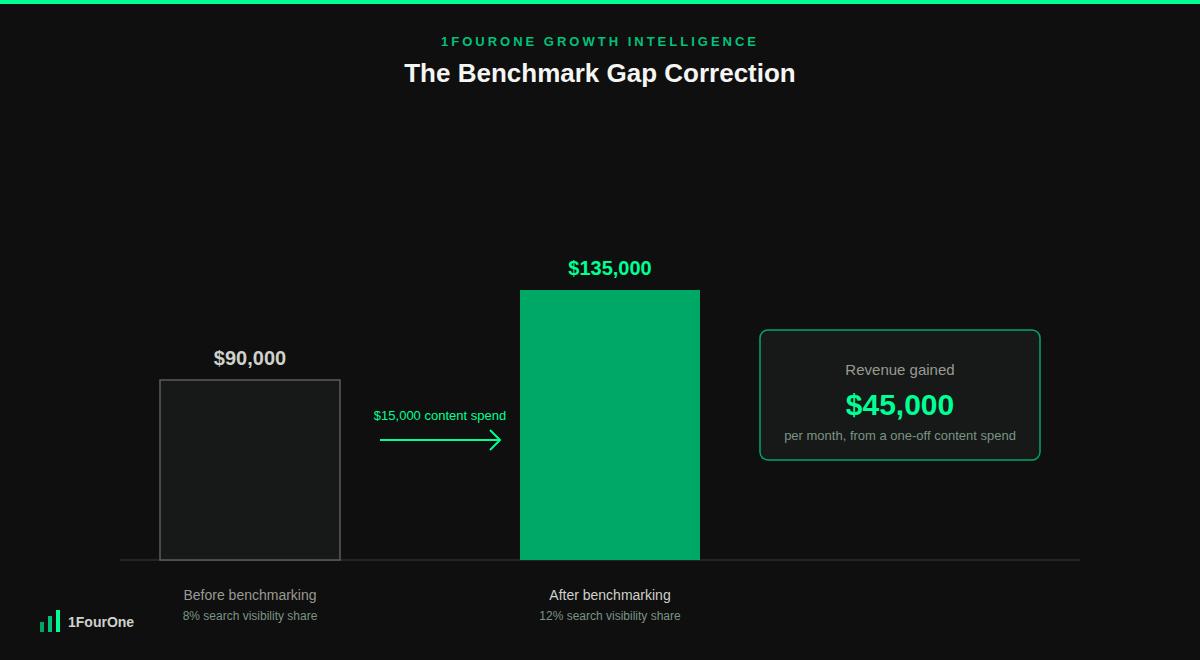
A benchmarking exercise against category-wide search data tells a different story. The brand’s non-branded search visibility share sits at just 8%, working out to 40,000 monthly organic sessions (500,000 multiplied by 0.08). The category leader, by contrast, holds a 15% share of the same search volume. At a 2.5% site conversion rate and a $90 average order value, the brand’s 40,000 sessions convert to 1,000 transactions (40,000 multiplied by 0.025), generating $90,000 in monthly organic revenue (1,000 multiplied by $90).
The benchmarking data reveals the brand is losing relative ground even while its own metrics look stable, because the category’s total search volume is growing faster than the brand’s share of it. The growth team commits a one-off $15,000 investment in targeted content built specifically around the keyword gaps the benchmarking exercise identified, closing part of the distance to the category leader.
Following the content rollout, the brand’s non-branded search visibility share rises from 8% to 12% of the same 500,000 monthly query volume, lifting organic sessions to 60,000 (500,000 multiplied by 0.12). Holding the conversion rate and average order value steady, these sessions convert to 1,500 transactions (60,000 multiplied by 0.025), generating $135,000 in monthly organic revenue (1,500 multiplied by $90).
The benchmarking-driven correction increases monthly organic revenue by $45,000 ($135,000 minus $90,000) from a single $15,000 content investment, a return the brand would never have identified from internal metrics alone. The gap to the category leader’s 15% share still exists, but this benchmarking discipline has converted an invisible blind spot into a quantified, trackable target.
You can construct a highly accurate market model by combining external data layers like organic search click-share, paid impression frequency, and relative traffic density indexes. Modern analytical platforms sample digital user panels to estimate unique monthly session volumes across specific domains. Aggregating these external indicators allows your growth team to map industry changes without needing direct back-end software access.
The most efficient approach is to ignore the raw, absolute traffic figures and focus entirely on the relative percentage shifts reported by a single tool over time. Choose one reputable data platform to serve as your corporate baseline and maintain that tracking system across all monitored competitors. This methodology ensures that any sampling bias remains uniform across the dataset, protecting the accuracy of your relative performance trends.
Your team should maintain a tiered monitoring structure that tracks both groups to secure complete market visibility. Allocate 70% of your analytical resources to monitoring immediate regional rivals who target your exact audience and impact your daily ad auction costs. Dedicate the remaining 30% to tracking global industry leaders to spot macro feature updates and structural funnel shifts early.
Use competitive benchmarks to discover open market gaps and unserved audience categories rather than blindly copying rival promotions. If a competitor scales their spending on a specific network, use that data to evaluate the auction viability, not to launch an identical campaign. True market visibility is designed to help you find low-competition opportunities, keeping your strategy proactive and focused on high-margin growth.
Macro benchmarking models should be fully refreshed on a strict quarterly schedule to guide long-term capital allocations and product strategy. Reviewing these high-level metrics too frequently introduces short-term data noise that can disrupt steady campaign development. Keep your weekly focus locked on tactical updates like tracking immediate rival creative changes and monitoring search keyword drops.
Allowing unindexed competitor expansions to quietly erode your retail margins is an expensive operational failure. At 1FourOne, we eliminate analytical blind spots by deploying a comprehensive competitive benchmarking framework that protects your traffic assets and improves your media efficiency. This is growth intelligence applied with rigour, not guesswork. Contact our growth operations team today to secure a data-driven competitive blueprint engineered specifically for your retail category.
Get your competitive audit in 48 hours and see exactly where your revenue is leaking.
Get Your Audit →