E-Commerce Profitability Benchmarking: Beyond Vanity Revenue

Top-line revenue is the ultimate vanity metric in modern digital retail. A mid-market brand scaling from $10 million to $20 million in Gross Merchandise Value (GMV) looks successful from the outside. If that growth was funded by escalating acquisition costs, aggressive discounting, and unoptimised fulfilment logistics, the business can be less stable than it was at half its size. Market share is secondary to cash flow generation and margin defence.
The core challenge for retail leadership is that general benchmarks are rarely useful. Comparing a high-AOV premium apparel brand against a low-cost food and beverage subscription service using a generic e-commerce baseline leads to poor resource allocation. To protect profitability, brands need to benchmark performance using precise, cohort-specific financial criteria.
This guide sets out that structure. It covers the gross, contribution, and net margin baselines required to run a sustainable online operation, and what real, sourced industry data says about each, so a brand can move from vanity revenue numbers to genuine e-commerce profitability benchmarking.
Running effective e-commerce profitability benchmarking starts with a precise definition of the metrics involved. Many organisations run thin because leadership confuses gross margin with order-level profitability. To run a high-performance retail operation, teams need to track three distinct layers of margin every month.
Gross profit margin is total revenue minus the fully loaded Cost of Goods Sold. COGS must not just reflect the factory purchase price, it needs to include inbound ocean freight, customs duties, port handling fees, and manufacturing compliance costs.
Gross Profit Margin = (Net Revenue − Fully Loaded COGS) ÷ Net Revenue × 100
If gross margin sits below 50%, sustaining paid acquisition campaigns becomes mathematically difficult. A thin margin leaves little room to absorb fluctuating ad costs, shipping increases, or platform transaction fees.
Contribution margin is the real indicator of order-level health. Getting the contribution margin calculation right means accounting for every variable expense required to fulfil a single transaction, including fully loaded COGS, outbound shipping subsidies, third-party logistics fees, payment processing, return processing, and variable marketing spend.
Contribution Margin = (Net Revenue − [COGS + Variable Fulfilment + Variable Marketing + Fees]) ÷ Net Revenue × 100
If this metric is negative or thin on first-time orders, the business is entirely dependent on long-term retention to ever become profitable.
Net profit margin is what is left after every operational expense, fixed cost, and tax obligation is subtracted from revenue, including payroll, rent, SaaS tooling, insurance, and professional services.
Net Profit Margin = Net Profit ÷ Total Revenue × 100
Top-line revenue is vanity. Net profit margin is what actually determines enterprise value and long-term viability.
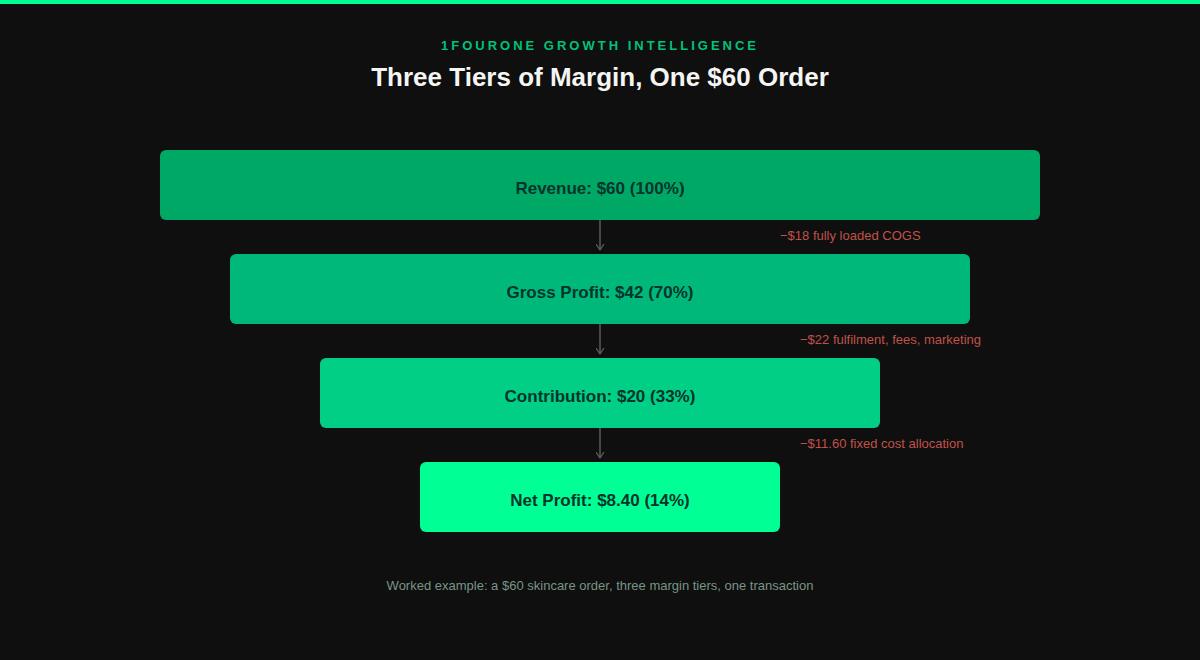
A worked example makes the gap between the three tiers concrete. A skincare brand sells a $60 product with $18 in fully loaded COGS, giving a 70% gross margin. Once $22 in fulfilment, payment fees, and variable marketing per order are subtracted, contribution margin per order drops to $20, or roughly 33%. After fixed costs such as salaries, software, and rent are allocated, net profit margin on that same sale might land at 14%, or $8.40.
Each tier tells a different story, and a brand that only tracks the first one is missing the two that actually decide whether the business is healthy.
Evaluating performance against a blended, all-industry baseline is the single most common failure in retail financial management. Category mechanics produce fundamentally different cost structures, so brands need to benchmark against direct vertical peers, not a generic average.
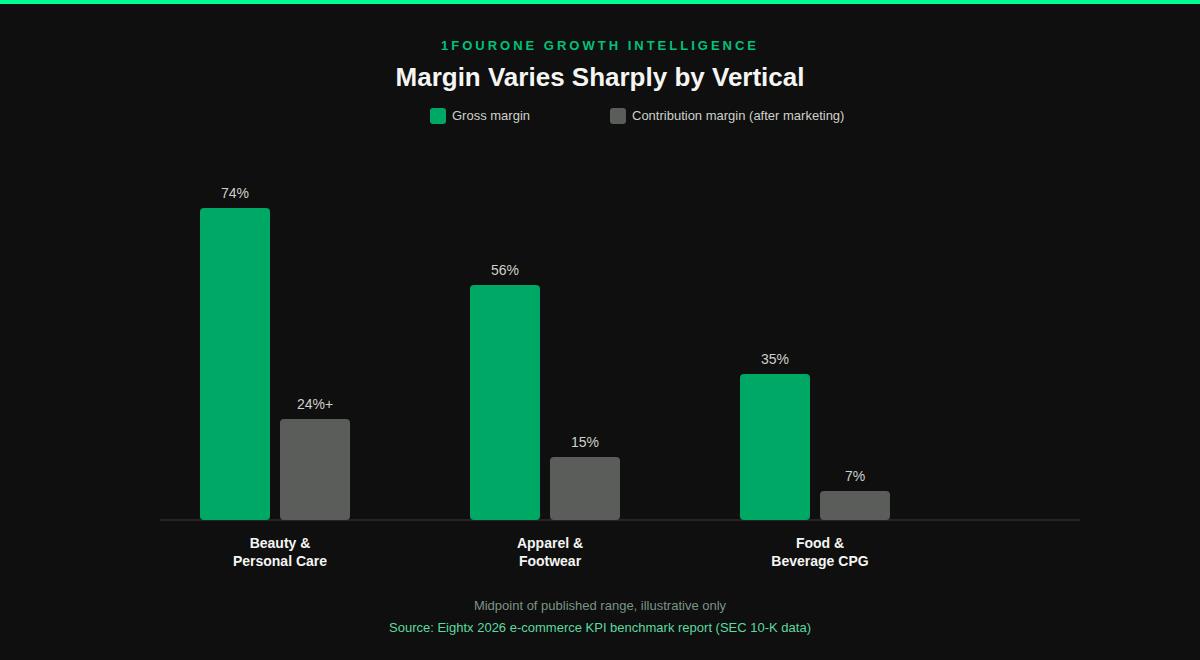
| Industry vertical | Gross margin (DTC) | Contribution margin (after marketing) |
|---|---|---|
| Beauty & personal care | 70–78% | 22%+ |
| Apparel & footwear | 50–62% | 12–18% |
| Food & beverage CPG | 28–42% | 4–10% |
Source: Eightx 2026 e-commerce KPI benchmark report, built from SEC 10-K filings of 40+ public DTC and CPG brands.
Consumer electronics and other commodity categories typically sit below all three of these bands, often in the 15–30% gross margin range, which is exactly why a single generalist benchmark is close to useless across categories this different. A beauty brand running a 12% net margin might look healthy to a generalist consultant, but proper benchmarking shows they are underperforming their vertical median significantly. A consumer electronics brand holding an 8% net margin, by contrast, may be performing well for a structurally thin-margin category.
The wider picture is more sobering than any single vertical number. The same Eightx analysis found that public DTC brands run a median operating margin of -2.4%, with only 4 of the 14 brands tracked clearing 5% EBITDA in FY2025. Plenty of brands posting strong revenue growth are doing so at a structural loss.
When benchmarking reveals a brand is underperforming its vertical peers, the fix is rarely to launch new acquisition campaigns. The more useful step in e-commerce profitability benchmarking is to examine the specific operational variables driving the gap, since real retail margin optimisation comes from fixing structural costs, not from spending harder on the same channels.
Paid media has seen increasing auction density, pushing acquisition costs up across every major platform. Categories with low emotional barriers to entry, such as fast fashion or generic cosmetics, see the highest cost-per-click volatility. Brands without a first-party data strategy are forced to keep re-acquiring returning customers through paid retargeting, which quietly erodes contribution margin month after month.
The physical attributes of a product portfolio affect profitability directly. Lightweight, high-margin goods like skincare or supplements generate strong revenue relative to their shipping weight. Oversized, fragile items like furniture require specialist logistics, long-term warehousing, and custom packaging, and if shipping promotions are not structured carefully, outbound delivery costs can absorb the entire gross margin.
Returns are a major source of revenue leakage. Home appliances typically see return rates around 2–5%, while fashion and apparel regularly sees 20–40%. Each returned item carries shipping fees, manual grading at the 3PL, repackaging, and eventual liquidation discounts on stock that cannot be resold at full price.
Over-reliance on promo codes and site-wide sales damages margin health quietly. Many mid-market merchants track an average discount rate as a single line item without measuring the compounding effect of stacked promotions at checkout, which is exactly the kind of friction a customer journey mapping audit is built to expose. When automated browser extensions apply layered discounts automatically, realised margin can fall well below the contribution threshold without anyone noticing until the quarter closes.
Many founders and private equity boards fixate on top-line scale, treating an enterprise generating $50 million in revenue as inherently more valuable than one capturing $15 million. That is a structural trap. In digital commerce, scaling before unit economics are stable acts as an accelerant for losses, not a sign of strength.
Consider a brand that tries to double revenue by increasing its paid social budget by 300%. As the platform expands targeting into colder prospecting cohorts, click-through and conversion rates fall, and blended CAC climbs from $25 to $48. If that brand’s average contribution margin per order was only $30, it now loses $18 on every new transaction those campaigns generate.
There is an old finance adage that captures this well: revenue is vanity, profit is sanity, cash is king. Scale should only follow structural unit efficiency. Trying to outgrow a thin contribution margin with ad spend is mathematically fatal, not just risky. Real e-commerce profitability benchmarking is what tells a business when it has reached its efficient frontier, so leadership can pause top-of-funnel investment and fix internal economics, such as shipping cost or checkout friction, before committing more capital to growth.
1FourOne’s approach to e-commerce profitability benchmarking replaces generic advice with precise financial engineering. We break your historical ledger into operational segments and map your numbers directly against verified competitive cohorts in your industry vertical.
This moves a leadership team beyond speculative marketing discussion. It produces an objective financial picture of exactly where profit is disappearing and which operational lever actually fixes it.
It depends entirely on the vertical. A 50% gross margin is comfortable for apparel but thin for beauty, where 70%+ is the norm. Always benchmark against your specific category rather than a blended average.
Monthly at minimum for the three core margin tiers. Vertical benchmarks and competitive cohort comparisons are useful to revisit quarterly, since category-wide cost structures shift more slowly than your own order-level economics. This is exactly the cadence a proper e-commerce profitability benchmarking practice runs on.
For scaling decisions, yes. Gross margin tells you whether the product itself is structurally viable. A proper contribution margin calculation tells you whether you can actually afford to acquire the customer buying it, which is the more urgent question once acquisition costs start rising.
Sometimes, if the gap between gross and net margin is explained by deliberate reinvestment in growth rather than structural inefficiency. The distinction matters: reinvestment is a choice, while a thin contribution margin on every order is a structural problem no amount of revenue growth will fix.
Relying on generic industry averages and top-line revenue targets carries real commercial risk. If your organisation does not have clear, monthly visibility into fully loaded gross, contribution, and net margin, you are managing growth in the dark. Protecting margin from rising acquisition costs and logistics inflation is a form of digital revenue protection, and it takes a rigorous e-commerce profitability benchmarking discipline, not a quarterly guess.
1FourOne provides established retail brands with specialised data analysis and strategic auditing to protect digital margins. We analyse your operational data, run precise cohort comparisons, and build optimisation playbooks to secure bottom-line profitability. Contact our Growth Intelligence team to baseline your current financial unit economics and engineer a genuinely profitable, sustainable retail model.
Get your competitive audit in 48 hours and see exactly where your revenue is leaking.
Get Your Audit →